Figure 4.
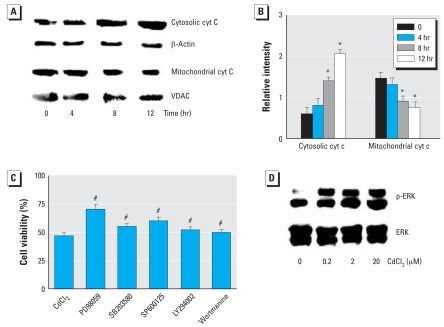
Effect of Cd2+ on cyt c and ERK in HEI-COI cells and the involvement of different signaling pathways in Cd2+ toxicity. (A) Protein extracts assayed for cyt c by Western blot analysis; β-actin was used as internal control in the cytosolic marker, and voltage-dependent anion channel (VDAC) was used as the mitochondrial marker. (B) Relative levels of cytosolic and mitochondrial cyt c quantitated by densitometry; the relative intensity of cytosolic cyt c was calculated between the band f cyt c and β-actin, and relative intensity of mitochondrial cyt c was calculated by the ratio between cyt c and VDAC. The change was Cd2+ exposure–time dependent. (C) Cd2+-induced reduction of cell viability, evaluated by MTT colorimetric assay, was partially blocked by preadministration of inhibitors of ERK, JNK, and p38, but the ERK inhibitor was more effective than the others. (D) Effect of Cd2+ on activation of ERK, showing a dose-dependent activation. Values shown are mean ± SE.
*p < 0.05 compared with untreated control cells. #p < 0.05 compared with Cd2+ alone.

