Figure 5.
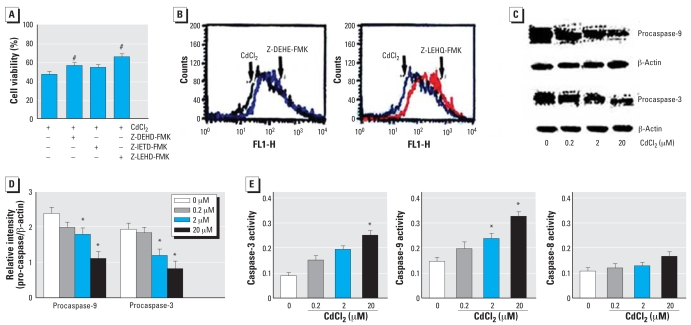
Effect of Cd2+ on caspase activities in HEI-COI cells. FL1-H, green fluorescence. (A) Cell viability, as evaluated by MTT colorimetric assay, of cells pre-treated with caspase inhibitors (2 μM) for 1 hr and then treated with Cd2+ (20 μM) for 8 hr. (B) Protective effect of caspase-3 and caspase-9 inhibitors on MMP (right shift), analyzed by flow cytometry using the DiOC6 fluorescent probe. (C) Western blot analysis of procaspase-3 and procaspase-9 after Cd2+ exposure in a dose-dependent manner. (D) Relative levels of the procaspase-3 and procaspase-9 quantitated by densitometry as a function of Cd2+ concentration. (E) Activities of caspase-3, caspase-8, and caspase-9 as a function of Cd2+ concentration, determined using a colorimetric kit. Values shown are mean ± SE.
*p < 0.05 compared with untreated control cells. #p < 0.05 compared with Cd2+ alone.

