
Fig. 1.
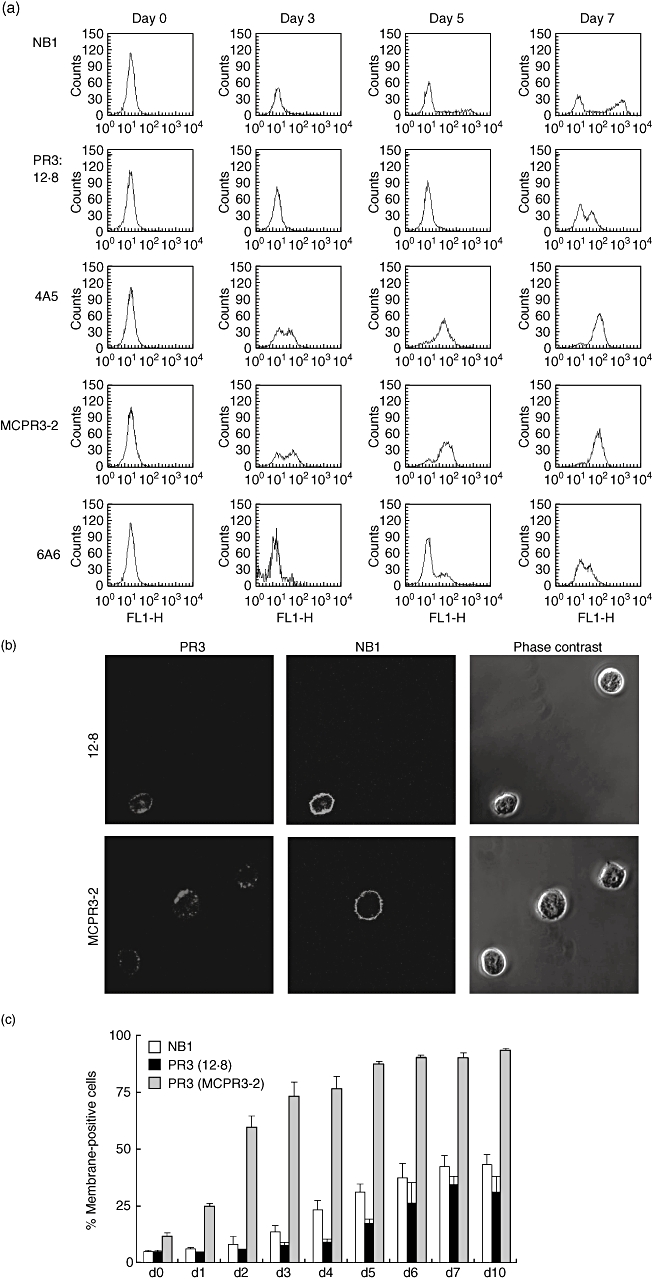
NB1 and proteinase 3 (PR3) surface display during neutrophilic differentiation in vitro. (a) Typical example of NB1 and PR3 surface presentation on live cells using 12·8, 4A5, 6A6 and MCPR3-2 monoclonal anti-PR3 antibodies that give two different patterns of membrane PR3 development. Confocal microscopy (b) demonstrates that the MCPR3-3 anti-PR3 antibody recognizes surface PR3 on developing neutrophils without NB1. (c) Quantification of NB1 and PR3 surface display development. Percentages of membrane-positive cells for either NB1 or PR3 cells are shown with the isotype set to 5% positive cells; n = 4 independent experiments per time-point during 10 days of differentiation.