
Fig. 3.
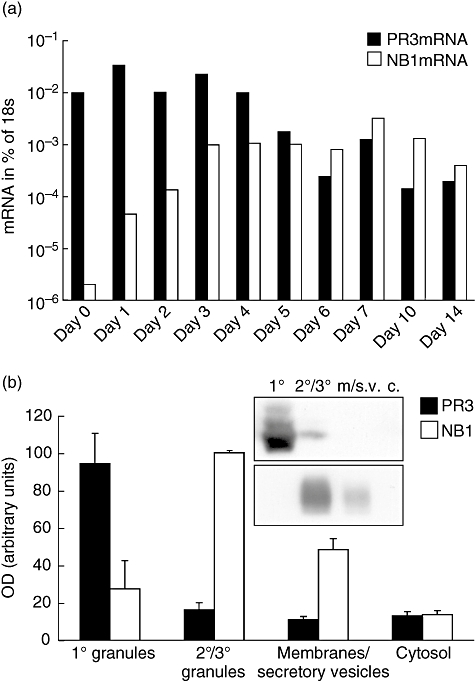
Proteinase 3 (PR3) and NB1 gene expression during neutrophil differentiation. (a) PR3-mRNA showed a gradual decline during in vitro differentiation, NB1 mRNA was up-regulated after addition of granulocyte–colony-stimulating factor and remained elevated during the observation period. Values are shown as percentage of housekeeper (18s). One typical of four independent experiments is shown. (b) PR3 and NB1 subcellular distribution in granules of peripheral blood neutrophils. Subcellular distribution is an indicator for the time of expression during development. PR3 was stored mainly in primary granules (OD = optical density: primary granules (1°): 94 ± 16, secondary/tertiary granules (2°/3°): 16 ± 4, secretory vesicles and plasma membranes (m./s.v) 11 ± 2, cytosol (c) 13 ± 2), NB1 in secondary and tertiary granules (OD: primary granules: 23 ± 15, secondary/tertiary granules: 100 ± 0, secretory vesicles and plasma membranes 28 ± 6, cytosol 14 ± 2). Immunoblot of a typical experiment and densitometric analysis from three (NB1) or four (PR3) independent experiments are shown.