
Figure 2. Time-lapse analysis of CaMKIIa reporter mRNA transport in live neurons from WT or Fmr1-KO.
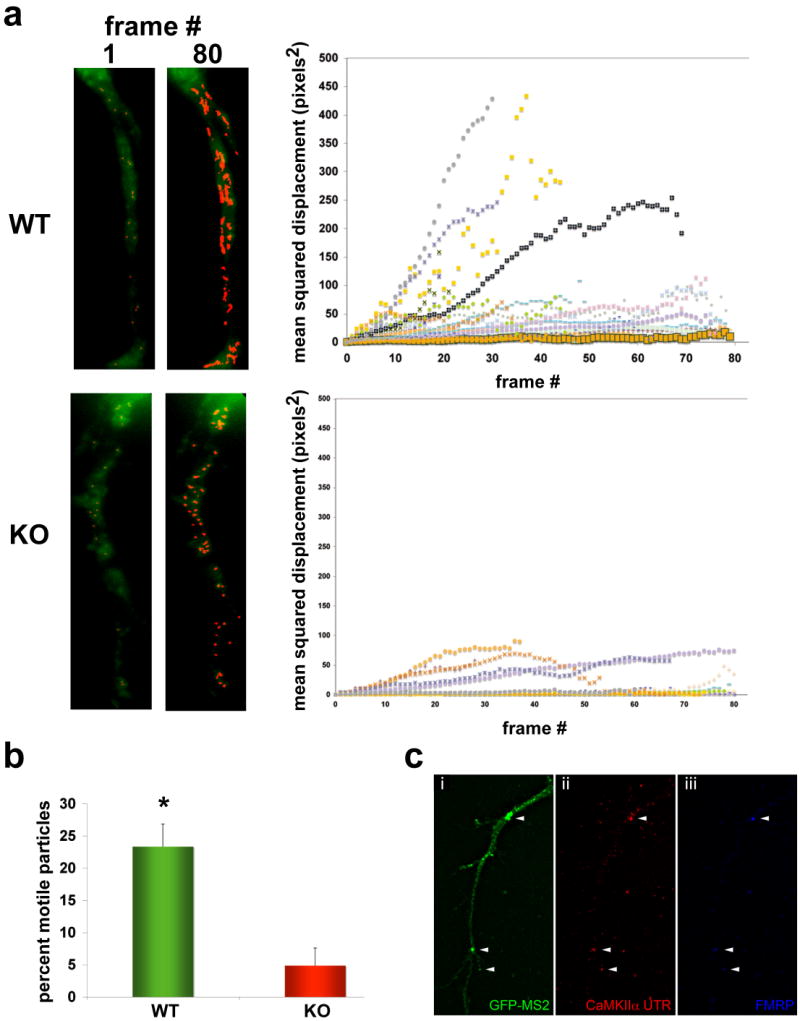
Neurons (10DIV) were transfected with a GFP-MS2-CaMKIIa mRNA reporter, and exposed to DHPG (50uM, 15 min.). mRNA movements were imaged over a two-minute interval, with each frame captured every 1.5s. (a) Images (left panels) show the first frame (1) and last frame (80) of the time-lapse series of GFP-MS2-CaMKIIa (green) and highlight the tracked mRNA particles (red). The mean-squared displacement (MSD) of individual particle trajectories were analyzed (graph, right) in WT (upper panels) and KO (lower panels) neurons, and an example of the MSD analysis graphs showing 24 particle trajectories for each genotype are shown at right (24 trajectories on graph; many are overlapping at bottom of graph and obscured by icons). The slope of the individual trajectories approximates the particle velocity, and the MSD measures the trajectory length over time.
(b) Histogram showing the average number of mRNA particles among several movies (n=6 neurons, 307 particles total, *p<0.02, mean±SEM) from both WT and KO neurons that were motile.
(c) Colocalization of CaMKIIa 3′UTR-MS2-GFP with endogenous FMRP. Fluorescence images of a hippocampal dendrite showing MS2-GFP (i, green), CaMKIIa-MS2 reporter mRNA (ii, red) and FMRP (iii, blue). Arrowheads show three granules in dendrites of this representative neuron triple-labeled where all colocalize, which was determined using 3D deconvolution and image reconstruction (see Suppl. Fig. 1f). Scale bar = 5um.