Figure 4.
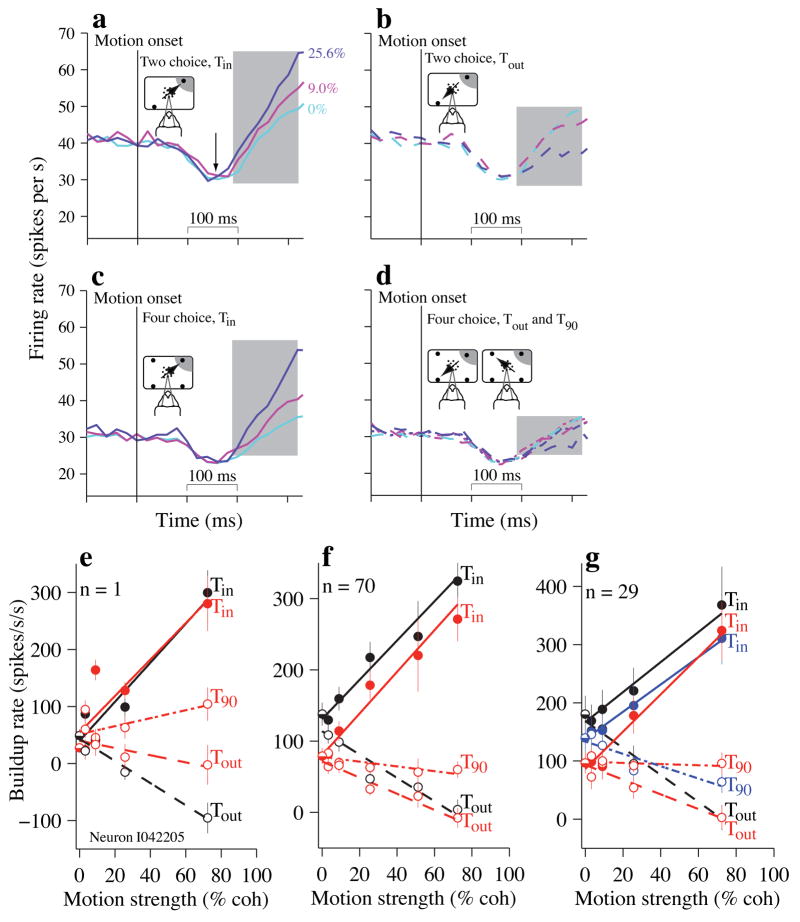
Neural responses during motion viewing depend on difficulty, (a–d) Population average firing rates (N=70 neurons) are shown for three motion strengths. Panels group together trials based on the direction of motion and the number of choices (cartoon insets). Correct and incorrect trials are included in these averages. The traces for 0% coherent motion are identical in panels (a,b) and in panels (c,d). Only three motion strengths are shown for clarity. Shaded rectangle indicates the epoch used to estimate the buildup rates (190–320 ms after the onset of stimulus motion), (a) 2-choice trials when the motion direction was toward Tin. Arrow indicates the stereotyped firing rate “dip” that occurs after motion onset, (b) 2-choice trials when the motion direction was toward Tout. (c) 4-choice trials when the motion direction was toward Tin. (d) 4-choice trials when the motion direction was toward Tout (dashed line) or toward an orthogonally positioned (T90) target (dot-dash line). The five traces on this panel are largely superimposed. The single cyan trace is for 0% coherent motion averaged across all choices (Tin, Tout and T90; same as cyan trace in c) (e–g) Effect of motion strength on buildup rates, (e) Single neuron example. Buildup rates were estimated for each motion strength; these buildup rates (±s.e.) are plotted as a function of motion strength. The slope of the fitted line estimates the effect of a unit change in motion strength on the buildup rate. Black, 2-choice; Red, 4-choice. 5 motion strengths were tested for this neuron (methods) (f) Same conventions as in (e) except that buildup rates were calculated in individual neurons and then averaged across the population (N=70 neurons) before fitting the line. Error bars are s.e. of buildup rates across neurons, (g) Population analysis for the 29 neurons tested with the 90° control condition in addition to 2- and 4-choice trials. Blue lines correspond to the 90° control condition; error bars are s.e. of buildup rates across neurons. Points corresponding to 51.2% motion strength are not included on this plot because this motion strength was tested in only 3 neurons.

