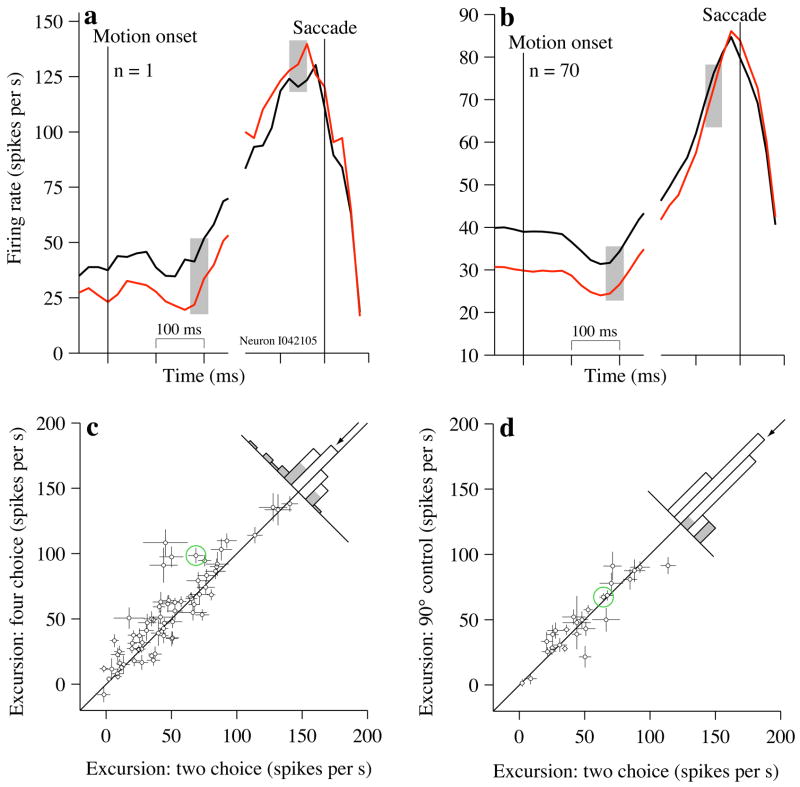
Figure 6.
Firing rate excursion is larger on the 4-choice task, (a) Firing rates on 2- and 4-choice trials at the beginning and end of the motion-viewing period for a single example neuron. Responses are aligned to motion onset (left) and saccade initiation (right). Black and red traces indicate responses on the 2- and 4-choice tasks, respectively. For purposes of display, traces are smoothed with a 30 ms exponential filter. Excursion is the difference between firing rates in the shaded regions. All responses leading to correct Tin choices and with RT>450 ms are used in this analysis. Firing rate excursion was 29.7±8.4 sp/s larger for 4-choice than for 2-choice. (b) Same as (a) except that traces reflect the average firing rate from 70 neurons and no smoothing was performed; firing rates were computed in 20 ms nonoverlapping bins, (c) Comparison of firing rate excursion on 2- and 4-choice tasks. Points are estimates of the firing rate excursion from single neurons. One point {170,159} was omitted from the scatter plot to facilitate scaling of the remaining points. Error bars show s.e. of the excursion (Eq. 2) and are occasionally obscured by the points. Green circle marks the example neuron in (a). Histogram depicts the differences in excursion on 2- minus 4-choice tasks. Arrow indicates the mean. Only correct responses to Tin targets were used for this analysis. Gray shading indicates individual neurons with significant differences (p<0.05). (d) Comparison of firing rate excursion on 2-choice and 90°-control tasks. Same conventions as in (b). The same neuron {170,157} was omitted from the scatter plot.

