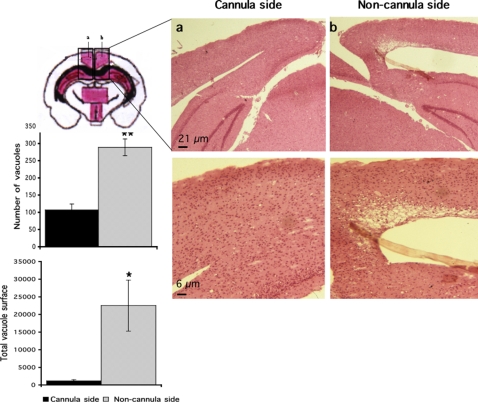
Figure 5. Less spongiosis in the vicinity of the guide cannula in prion-infected mice treated with ΨPrPQ167R.
Tissue sections were stained with hematoxylin and eosin. Letters a and b on the schema correspond to the secondary visual cortex (SVC) and a part of the hippocampal CA1 region. Bars, 6 µm. Histograms represent either the mean number of vacuoles or the mean total vacuolar surface in the SVC areas. The number of vacuoles was counted in one square of 250,000 µm2, corresponding to nearly all the SVC surface, and repeated in three independent sections. The total vacuolar area was determined by drawing the contour of each vacuole present in one square of 2,500 µm2 using Mercator software (Explora Nova, La Rochelle, France), which was repeated in three independent sections from the same mouse. The histograms represent the means±s.e.m. Statistical analysis was performed using STATVIEW 5 software. Values were analyzed by ANOVA followed by the PLSD Fisher test (n = 3). The number of vacuoles in the treated side was statistically different from the non-treated area (**, p<0.005). The total vacuolar area in the cannula side was statistically different from that in the non-cannula side (*, p<0.05).

