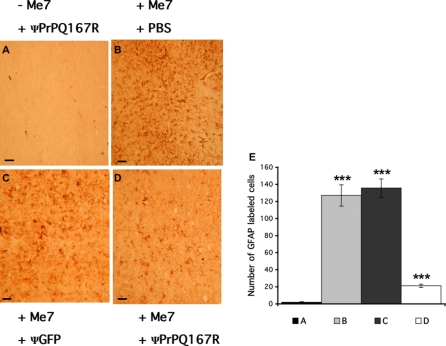
Figure 7. Immunohistochemistry for GFAP in thalamus sections close to the injection site.
The plus (+) and minus (−) signs indicate that the mice were or were not inoculated (A), respectively, with the ME7 prion strain. Mice received two injections of either PBS (B) or lentivirus carrying the GFP (C) or PrPQ167R genes (D). GFAP labelling was performed on nine independent brains (3 per group). The sections presented here are representative of the global labelling in the thalamus. Bars, 6 µm. Histograms represent the mean number of GFAP-labelled cells in one mouse of each treated group, which was measured by counting the GFAP-positive cells in five squares of 10,000 µm2 each, using Mercator software. The histograms represent the means±s.e.m. Statistical analysis was performed using STATVIEW 5 software. Values were analyzed by ANOVA followed by the PLSD Fisher test (n = 5). Multiple comparison analysis between A, B, C, and D showed that they were all statistically significant (***, p<0.0001), except for A versus D and B versus C.

