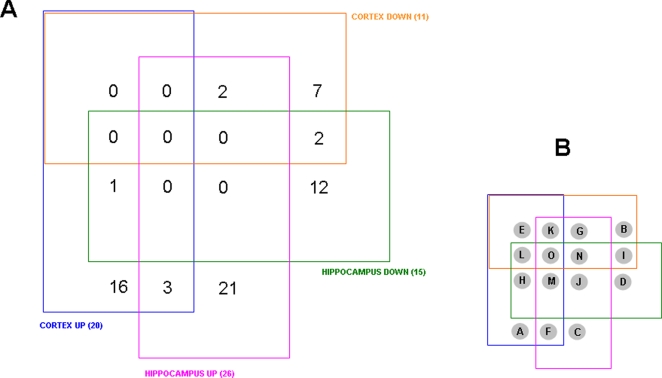
Figure 8. Four-way Venn diagram analysis for significantly regulated GO functional groups in 3xTgAD compared to control from cortex and hippocampus.
A. Numbers of functional groups existing in the potential 15 loci in the Venn diagram between the four paradigms, i.e. up- or down-regulation in cortex or hippocampus. B. Key for loci in the four-way Venn diagram in A. The functional groups represented in the occupied loci are listed in Table 3.

