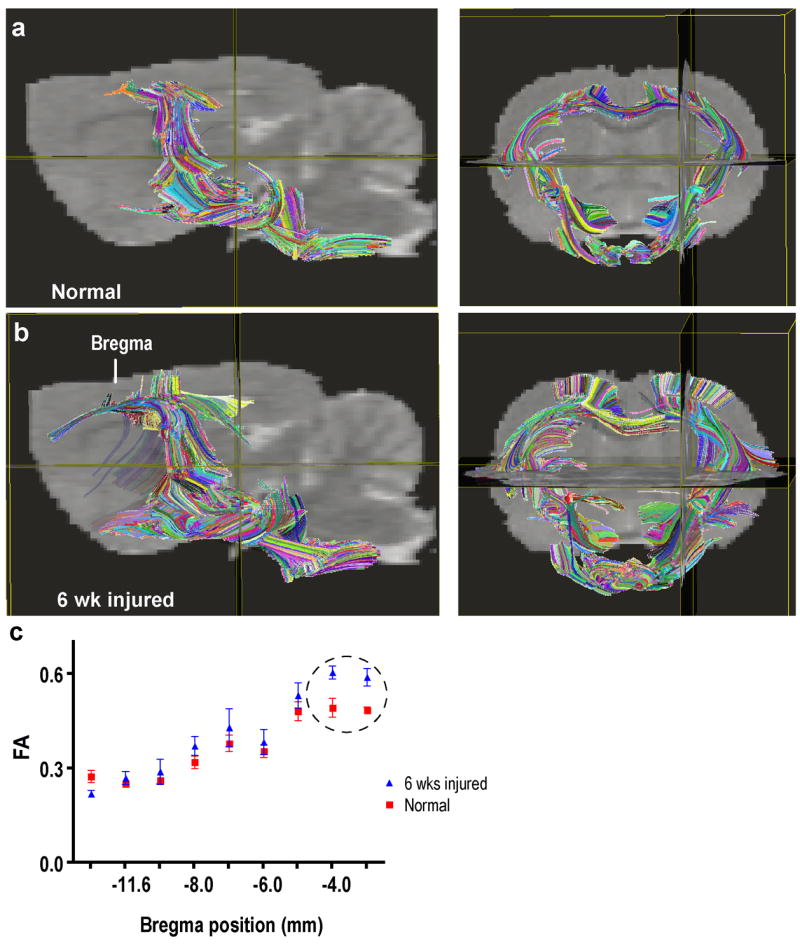
Figure 4.

DTI image comparisons of brains from normal and SCI animals. Brains from control a) and (b) SCI rat presented in both sagittal and coronal plane. (c) FA values (mean ± SD) measured at different positions along the CST. The circle in the graph represents the regions of significant difference at the level of both the internal capsule and cerebral peduncle.
