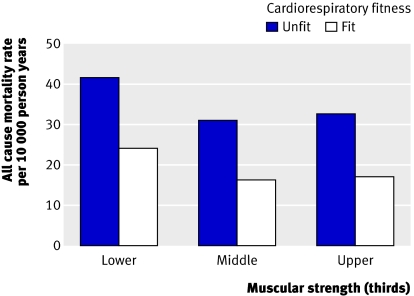
Fig 3 Number of men and age adjusted all cause death rates per 10 000 person years according to thirds of muscular strength and cardiorespiratory fitness categories. Adjusted death rate was inversely related to muscular strength within fit cardiorespiratory category (P=0.008 for trend) but not within unfit category (P=0.44 for trend), and inversely related to cardiorespiratory fitness within lowest third (P=0.003) and middle third (P=0.03) for muscular strength but not within highest third (P=0.27)

An official website of the United States government
Here's how you know
Official websites use .gov
A
.gov website belongs to an official
government organization in the United States.
Secure .gov websites use HTTPS
A lock (
) or https:// means you've safely
connected to the .gov website. Share sensitive
information only on official, secure websites.
