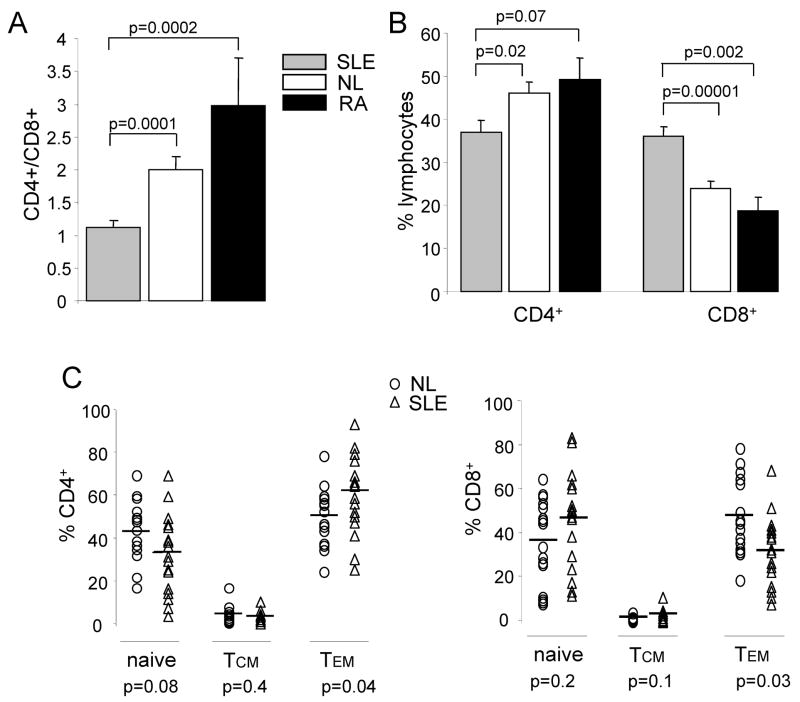
Figure 1. Expression of T cell subsets in SLE, RA and normal donors.
(A) Flow cytometry analysis using anti-CD4 and anti-CD8 antibodies as gating antibodies of SLE patients (n=18), healthy controls (n=16) and RA patients (n=4). CD4/CD8 ratio indicates the relative proportions of T cells expressing CD4 or CD8. (B) Levels of expression of CD4 and CD8 in the 3 populations. C. Relative levels of naïve, Tcm and Tem cells in CD4+ (left) and CD8+ (right) lineages for SLE (n=18) and normal (n=16) individuals. Normal and SLE T cell populations were further characterized as follows: naïve (CCR7+ CD45RO−), Tcm (CCR7+ CD45RO+), and Tem (CCR7− CD45RO+). There was an increase in CD4+ Tem cells accompanied by a decrease in CD8+ Tem populations in SLE as compared to healthy donors. The levels of significance within the T cell subsets are indicated at the bottom.

