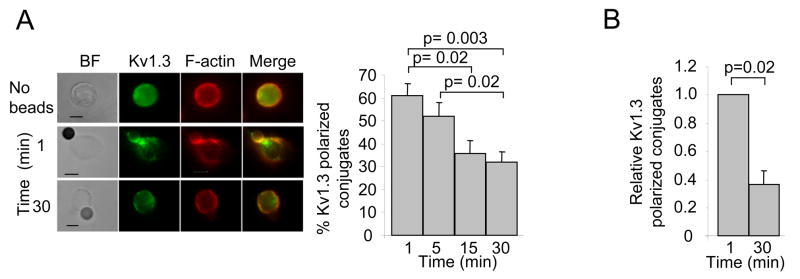
Figure 6. Kv1.3 channel recruitment in the IS in activated healthy T cells parallels SLE T lymphocytes.
A. T cells were pre-activated by exposure to PHA (4μg/ml) in the presence of autologous PBMCs for 72 hr. Pre-activated T cells were or were not stimulated with CD3/CD28 beads for 1–30 min. Left panels: representative photomicrographs. Right Panels: Quantitative analysis of Kv1.3 channel recruitment in the IS of activated T cells was performed as described in the methods section. The histogram shows the percentage of cells showing Kv1.3 accumulation at the IS at different time points (1–30 min). The data are the average of >50 cells/donor from seven healthy donors except 5 min, six donors. B. Activated healthy T cells were incubated with SEB-pulsed EBV B cells for 1 or 30 min. T/B cell conjugates were quantitatively evaluated for the recruitment of Kv1.3 channels as described in the methods section. The histograms represent an average of the relative percentage of Kv1.3 polarized conjugates (normalized for the maximum recruitment of Kv1.3 polarized conjugates) in 3 healthy donors. At least 10 T/APC conjugates were evaluated for each donor per time point.

