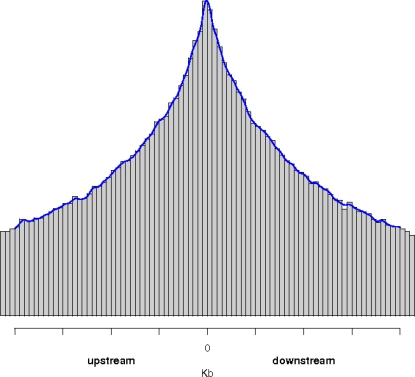
Figure 3. Distribution of 1,250,000 integration distances (kb) from the transcription start site (TSS) of the nearest gene (Y) randomly generated from a Uniform distribution.
The solid line is the kernel density estimate plotted within a ±30 kb window for a better graphical visualization of the ”bell-shape” curve.

