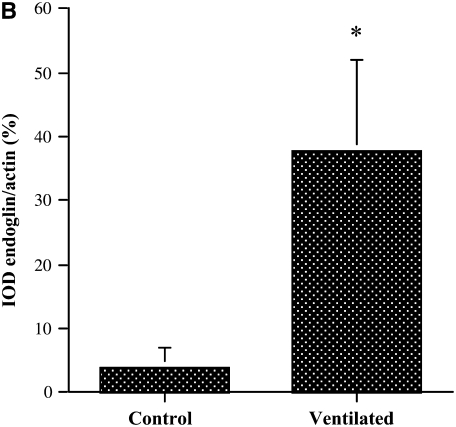
Figure 2.
Western blot analysis of pulmonary endoglin protein levels in early control subjects and short-term ventilated patients. (A) Representative Western blot analysis of endoglin protein expression in whole lung homogenates. Appropriately sized bands were detected for endoglin (approximately 170 and 160 kD). Actin (42 kD) served as internal loading control. Human umbilical vein endothelial cells (EC) served as positive control. (B) Densitometry of 170-kD L-endoglin Western blot analysis. Values represent means ± SD of five samples in each group. *P < 0.01 versus control. IOD = integrated optical density.


