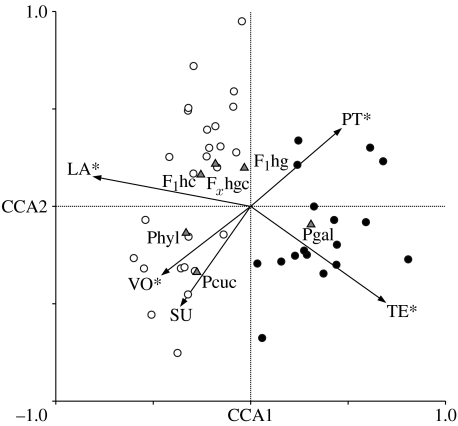
Figure 2.
Full model CCA results of EV and SV on Daphnia communities in all 43 lakes north (open circles) and south (filled circles) of the Alps. Vectors represent environmental (VO, lake volume; PT, total phosphorus load; SU, lake surface; and TE, temperature) and spatial (LA, latitude) parameters that point in the direction of increasing importance for the respective variables. Arrow angles relative to axis and EV- or SV-variables indicate correlation strengths. Solid triangles symbolize relative proportions of various Daphnia taxa (Pgal, D. galeata; Phyl, D. hyalina; Pcuc, D. cucullata; F1hg, D. galeata×D. hyalina; F1hc, D. hyalina×D. cucullata; and Fxhgc, D. galeata×D. hyalina×D. cucullata). Asterisks indicate variable explaining a significant amount of variation in the Daphnia taxa dataset (see table 2).

