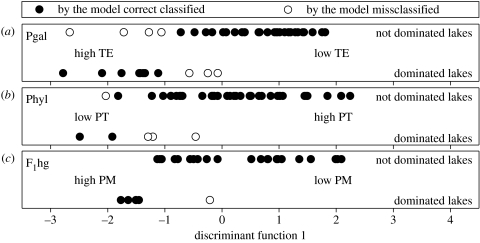
Figure 3.
Distribution of ‘single taxon dominated’ (50% or more) and not dominated Daphnia communities along extracted first discriminant function: (a) D. galeata dominance (Pgal), (b) D. hyalina dominance (Phyl) and (c) F1hg dominance (F1hg). Discrimination for D. galeata and D. hyalina dominance was based on all 43 lakes and for F1hg dominance was based on 28 lakes with information about the trophic lake history (historic dataset; table 1). PT, total phosphorus load; TE, temperature; and PM, maximal phosphorus load.

