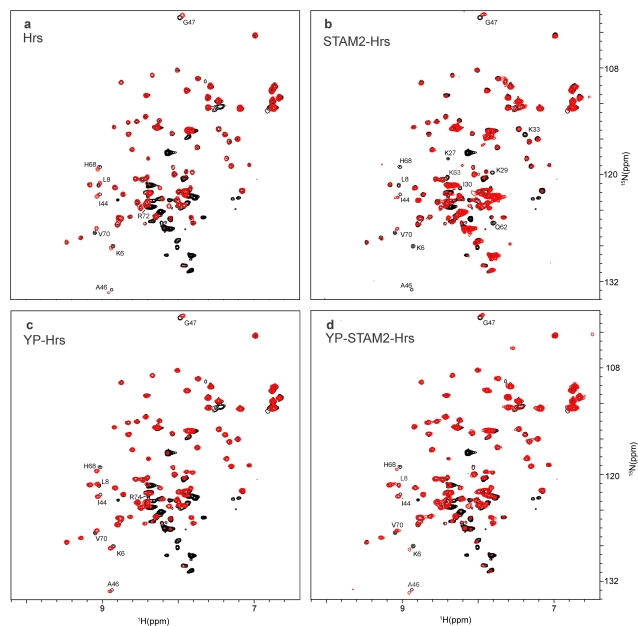
Figure 2. NMR-spectra of Ubiquitin-ligand complexes.
1H{15N}HSQC spectra of E. coli after 3-h of [15N]-Ubiquitin overexpression (black), overlaid with spectra (red) obtained from E. coli after 2-h of [15N]-Ubiquitin overexpression and: a) 4-h of Hrs overexpression; b) 4-h of STAM2 & Hrs co-overexpression; c) 4-h of Hrs and 2-h of Fyn kinase co-overexpression; d) 4-h of Hrs & STAM2 and 2-h of Fyn kinase co-overexpression. Individual peaks exhibiting either a chemical shift change >0.1 ppm or significant differential broadening (>30% change in intensity) are labeled with corresponding assignments. The strong peaks in the spectra between 8.5 and 7.8 ppm correspond to various metabolites of [U-15N] ammonium ion. NMR experiments were acquired at T = 298 K on Bruker Avance 700 MHz NMR spectrometer equipped with a cryoprobe. 1H{15N}-edited HSQC data were recorded with 16 transients as 512{128} complex points, apodized with a squared cosine-bell window function and zero-filled to 1k{256) points prior to Fourier transformation. The corresponding sweep widths were 12 and 35 ppm in the 1H and 15N dimensions, respectively. The Q49 peak is obscured by peaks from the [U-15N] ammonium ion metabolites and is not labeled. Ubiquitin ligands are indicated in each panel.

