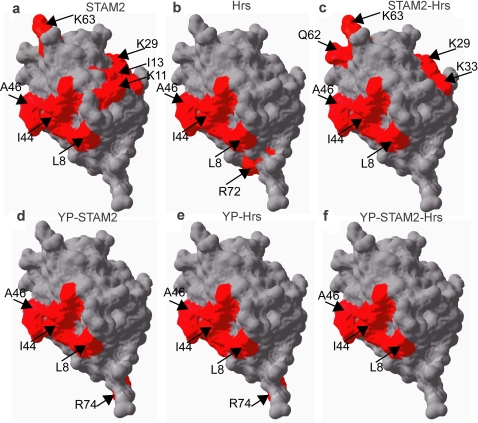
Figure 3. Interaction surface maps of Ubiquitin-ligand complexes.
Interaction surface of Ubiquitin mapped onto the three-dimensional structure of Ubiquitin (PDB code 1D3Z). Individual residues exhibiting either a chemical shift change >0.05 ppm or significant differential broadening are indicated in red. All perturbed residues lie on the Ubiquitin surface and, therefore, reflect changes in the interaction surface of the molecule rather than changes in tertiary or quaternary structure. a) STAM2-Ubq interaction; b) Hrs-Ubq interaction; c) STAM2-Hrs-Ubq interaction; d) phosphorylated STAM2-Ubq interaction (YP-STAM2); e) phosphorylated Hrs-Ubq interaction (YP-Hrs); f) phosphorylated STAM2-Hrs-Ubq interaction (YP-STAM2-Hrs). Ubiquitin ligands are indicated in each panel.

