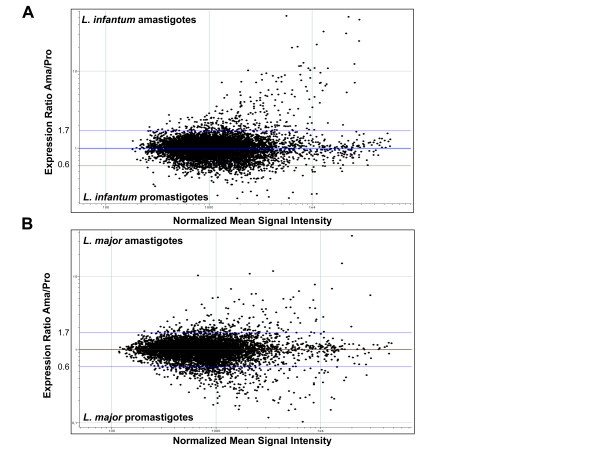
Figure 1.
Whole-genome expression profiling of amastigote vs. promastigote upregulated transcripts in Leishmania spp. Scatter plots showing the distribution of signal intensities generated by the DNA microarray experiments employing total RNA of L. infantum (A) and L. major (B) extracted from promastigote (Pro) and amastigote (Ama) developmental life stages. The horizontal axis displays the normalized mean signal intensity for each gene (([Pro]+ [Ama]/2) and the vertical axis shows the normalized ratio of amastigote versus promastigote gene expression ([Ama]/[Pro]). External line represents a 1.7-fold change. Genes significantly upregulated in the amastigote stage are above the line at 1.7 and genes upregulated in the promastigote stage are below the line at 0.6. The data presented here are the average of six independent biological replicates for L. infantum and four independent biological replicates for L. major.

