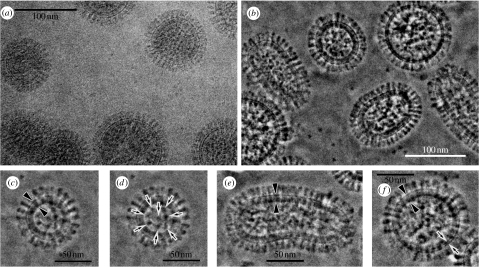
Figure 4.
The 300 kV cryo-TEM images of vitrified influenza A viruses under (c) the plasma membrane and (d) an inner core. (a) A conventional TEM and (b) a ZPC-TEM micrograph for influenza A viruses. (c,d) Enlarged images of a spherical virion with a complete matrix layer (c, arrowheads) and an inner core (d, arrows). (e) An enlarged image of an elongated virion with a complete matrix layer (arrowheads). (f) An enlarged image of a spherical virion with a partial matrix layer (arrows). Adopted from figs. 1 and 2 of Yamaguchi et al. (2007).

