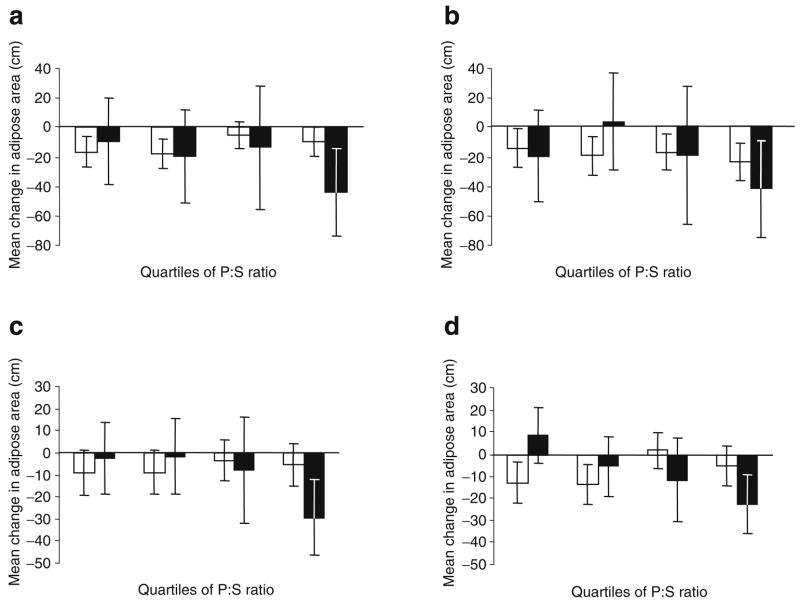
Fig. 3.
Interaction between Pro12Ala genotype and polyunsaturated to saturated dietary fatty acid ratio (P:S ratio) for CT-assessed abdominal fat areas SAT lumbar 2/3 (a), SAT lumbar 4/5 (b), VAT lumbar 2/3 (c) and VAT lumbar 4/5 (d) in individuals randomised to metformin treatment. White bars, data from Pro12Pro genotype carriers (n=198); black bars, data from Ala12X genotype carriers (n=51). Data are adjusted means and 95% CIs. p= 0.125 (a), p=0.626 (b), p=0.064 (c) and p=0.0003 (d) for the tests of interaction between genotype (Pro12Pro vs Ala12X) and P:S ratio as a continuous trait, as reported in the Results

