FIG. 1.

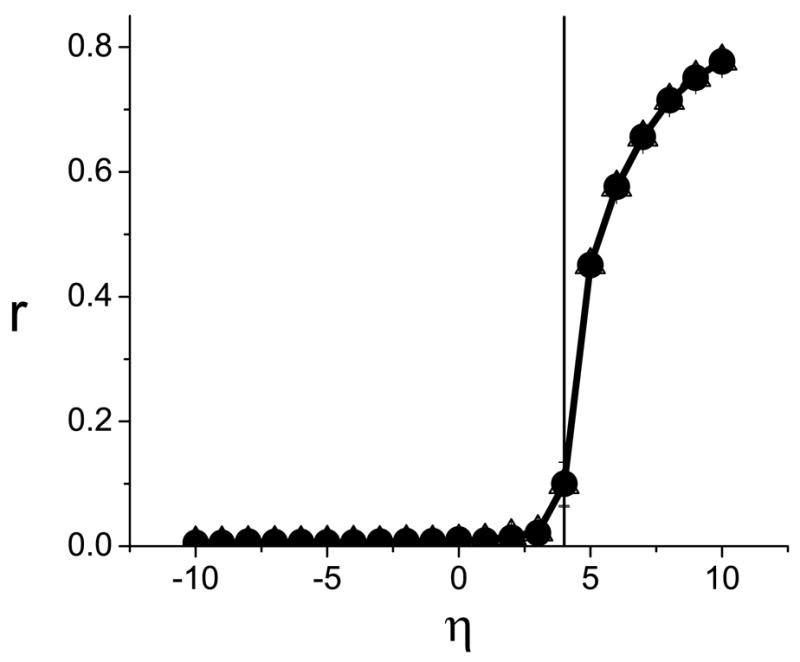
Numerical calculation of the order parameters (●, △) versus η for case A in Table II. The vertical line corresponds to the predicted value η* = 4. The data point nearest η* is at η = 4.15.

Numerical calculation of the order parameters (●, △) versus η for case A in Table II. The vertical line corresponds to the predicted value η* = 4. The data point nearest η* is at η = 4.15.