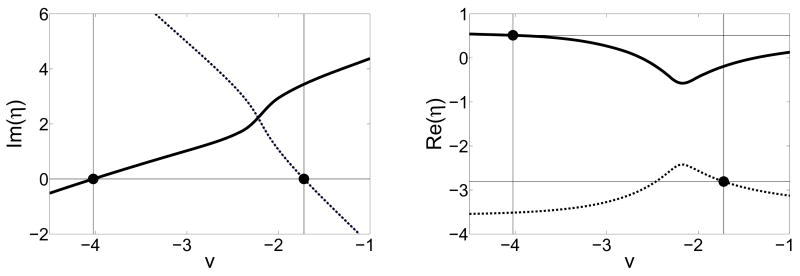
FIG. 3.
Case E, different populations. The left panel shows Im(η(1,2)), with the vertical lines identifying roots at υ1 = −4.024 and υ2 = −1.722. The right panel shows Re(η(1,2)); values at the roots found above are indicated by horizontal lines, yielding and . Thus, we expect synchronization to occur at these values as η is either increased or decreased away from zero.

