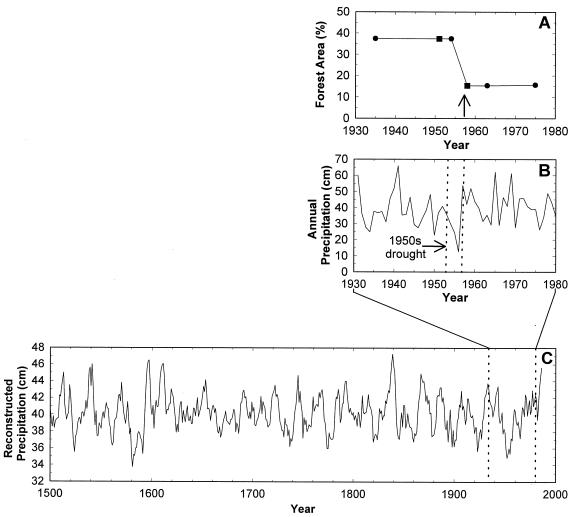
Figure 2.
(A) Changes in percent forest area between 1935 and 1975. Circles represent GIS estimates derived from mapped data; squares represent estimates for years with only partial aerial photograph coverage. The arrow indicates the time of historical observations of extensive tree mortality (22). (B) Annual precipitation at Bandelier National Monument, 1930–1980, highlighting the period of extreme drought (dashed vertical lies). (C) Annual precipitation (5-yr running average), reconstructed from dendrochronological records for the Jemez Mountains, encompassing the study site (Unpublished data from J. S. Dean and G. S. Funkhouser, personal communication). The magnitude of the 1950s drought (within the dashed vertical lines) was exceeded only by the drought of the late 1500s. Other precipitation reconstructions in the region show similar patterns (23–25).

