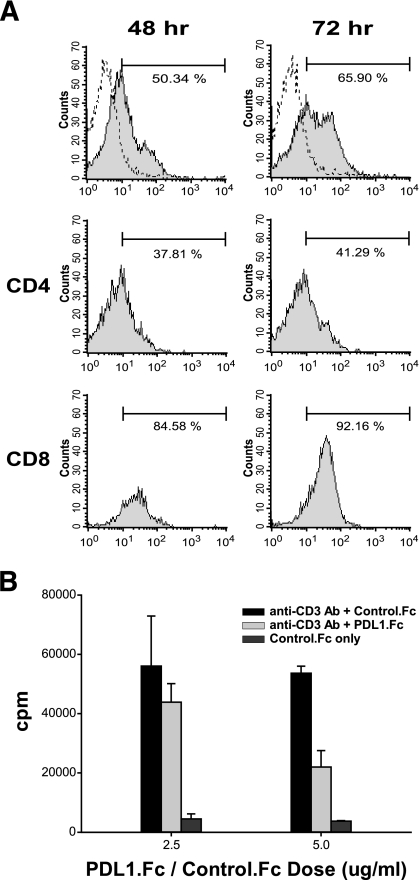
FIG. 1.
Expression of PD-1 and the inhibitory effect of PD-L1 on NOD T-cells. A: Splenocytes from 8-week-old female NOD mice were cultured in plates coated with 2 μg/ml anti-CD3 antibody for 48 (left) or 72 (right) hours. The stimulated cells were then stained with anti–PD-1 antibody (filled region), and the negative control of unstained cells is indicated as a dotted line. Percentages of PD-1+ cells in CD4 and CD8 populations (middle and bottom panels, respectively) are shown in the top right corner of the histograms. B: Splenocytes were cultured in plates coated with 2 μg/ml anti-CD3 antibody and 2.5 or 5 μg/ml PD-L1.Fc or control IgG1.Fc. Cells were pulsed with 5 μCi/ml [3H]thymidine at 60 h, and the incorporation was measured at 72 h by scintillation counting.

