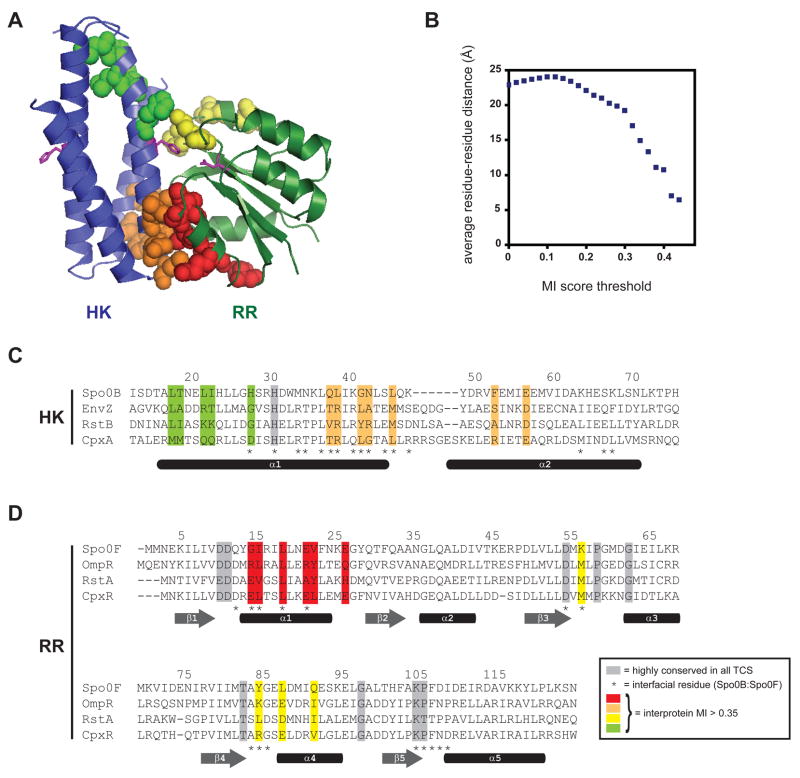
Figure 2. Specificity determining residues map to the interface of a two-component signal transduction complex.
(A) Structure of the histidine phosphotransferase Spo0B in complex with the response regulator Spo0F (PDB: 1F51). No HK-RR cocrystal structure has yet been solved. However, the Spo0B:Spo0F serves as a suitable proxy because the four-helix bundle of Spo0B is similar to that formed by the DHp domain of histidine kinases. Residues with the highest intermolecular mutual information scores (> 0.35) are shown by spacefilling. Spo0B is a dimer, but for clarity, only one set of residues is shown. Each molecule contains two regions of high-scoring residues; those in the histidine kinase are colored green and orange and those in the response regulator are colored red and yellow. Additional views are shown in Figure S1. (B) Plot of average residue-residue distances as a function of covariation score for all pairs of positions from the multiple sequence alignment (see Figure 1B and Supplemental File 1) that include one site within the DHp domains of the kinase and one site within the response regulators. (C) Primary sequence alignment of the histidine kinases EnvZ, RstB, and CpxA with the histidine phosphotransferase Spo0B. Residues showing strongest covariation with residues in the response regulator are highlighted in green and orange, as in panel A. (D) Primary sequence alignment of the response regulators Spo0F, OmpR, RstA, and CpxR. Residues showing strongest covariation with residues in the histidine kinase are highlighted in red and yellow, as in panel A. Highly conserved residues are shaded in grey. Interprotein contact residues are marked by asterisks below the sequence alignments along with approximate locations of secondary structure elements.

