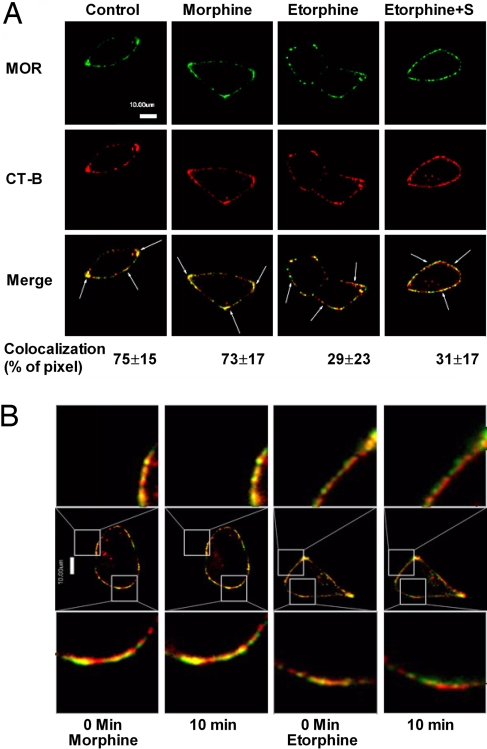
Fig. 2.
MOR located in lipid raft indicated by confocal microscopy. (A) Confocal images of MOR and CTX-B colocalization. Immunofluorescence procedures were described as in Materials and Methods. Treatments were same as in Fig. 1. The numbers below the merge panels represent the pixels colocalization ratios that were calculated by IPLab 4.0. (B) Live cell confocal images of MOR and CTX-B. Live images were taken before and 10 min after 1 μM morphine and 10 nM etorphine treatments. Only etorphine induced significant decrease of the colocalization between MOR and CT-B.

