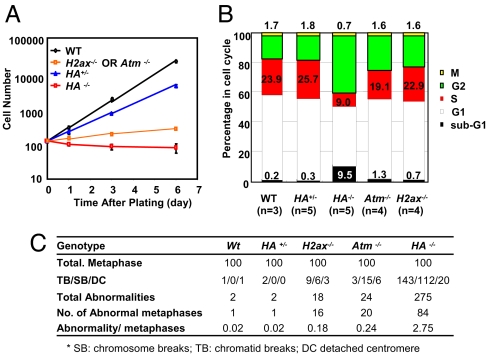
Fig. 2.
Proliferation defects and genomic instability in H2AX and ATM double deficient MEF. (A) Proliferation of WT, HA−/−, Atm−/− and H2ax−/− MEFs. Approximately 2.5 × 10² P0 MEF were plated in each well of a 24 well plate at day 0, trypsinized and counted every other day by using trypan blue exclusion. The standard deviations are calculated based on the results from at least three independent experiments performed on independent MEF lines of each genotype. (B) Cell cycle analyses of overnight culture of p0 E10.5 MEF of indicated genotypes. The cells were incubated with BrdU and colcemid (100 ng/ml) for 2 h before collection for cell cycle assay. The sub-G1, G1, S, and G2/M phase percentages were calculated from BrdU-PI staining. Mitotic cells were identified through histone H3 Ser-10-phosphorylation staining. G2 phase percentage was obtained by subtracting the M phase percentage from the G2/M phase percentage. The bar graphs represent the average of three to five independent MEF lines from each genotype. (C) Summary of cytogenetic analyses of p0 MEFs. DAPI staining was used to quantify the abnormalities.

