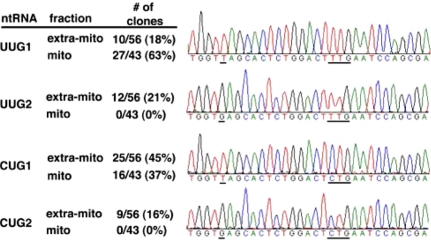
Fig. 3.
Distribution of imported tRNAGln species in rat mitochondrial RNA fractions. (Left) Table summarizing the total distribution of each isoacceptor in the various fractions. Similar numbers were obtained for human mitochondria (data not shown). (Right) DNA sequencing traces representative of the different products obtained from the RT-PCR experiments in (Fig. 2). The single-nucleotide differences that can be discerned with the primers used are underlined. Also underlined are the anticodon sequences.

