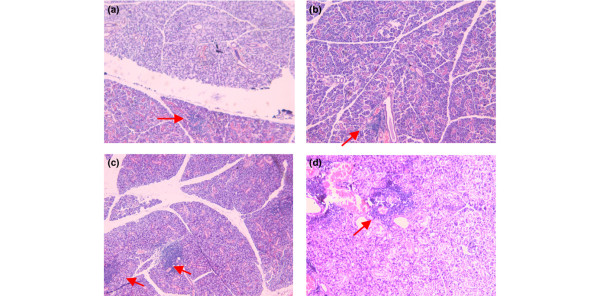
Figure 4.
Effect of α-fodrin immunization on the histopathologic analysis of NOD mice. Effect of α-fodrin immunization on the histopathologic analysis in the (a) 1 μg/dose α-fodrin group, (b) 10 μg/dose α-fodrin group, (c) PBS group, and (d) Glutathione transferase group. Tissues were stained with H&E. Lymphocytic infiltration was decreased in the glands of α-fodrin-administrated groups ((a) and (b) Each red arrow represent the focus of the lyphocytic infiltration.).

