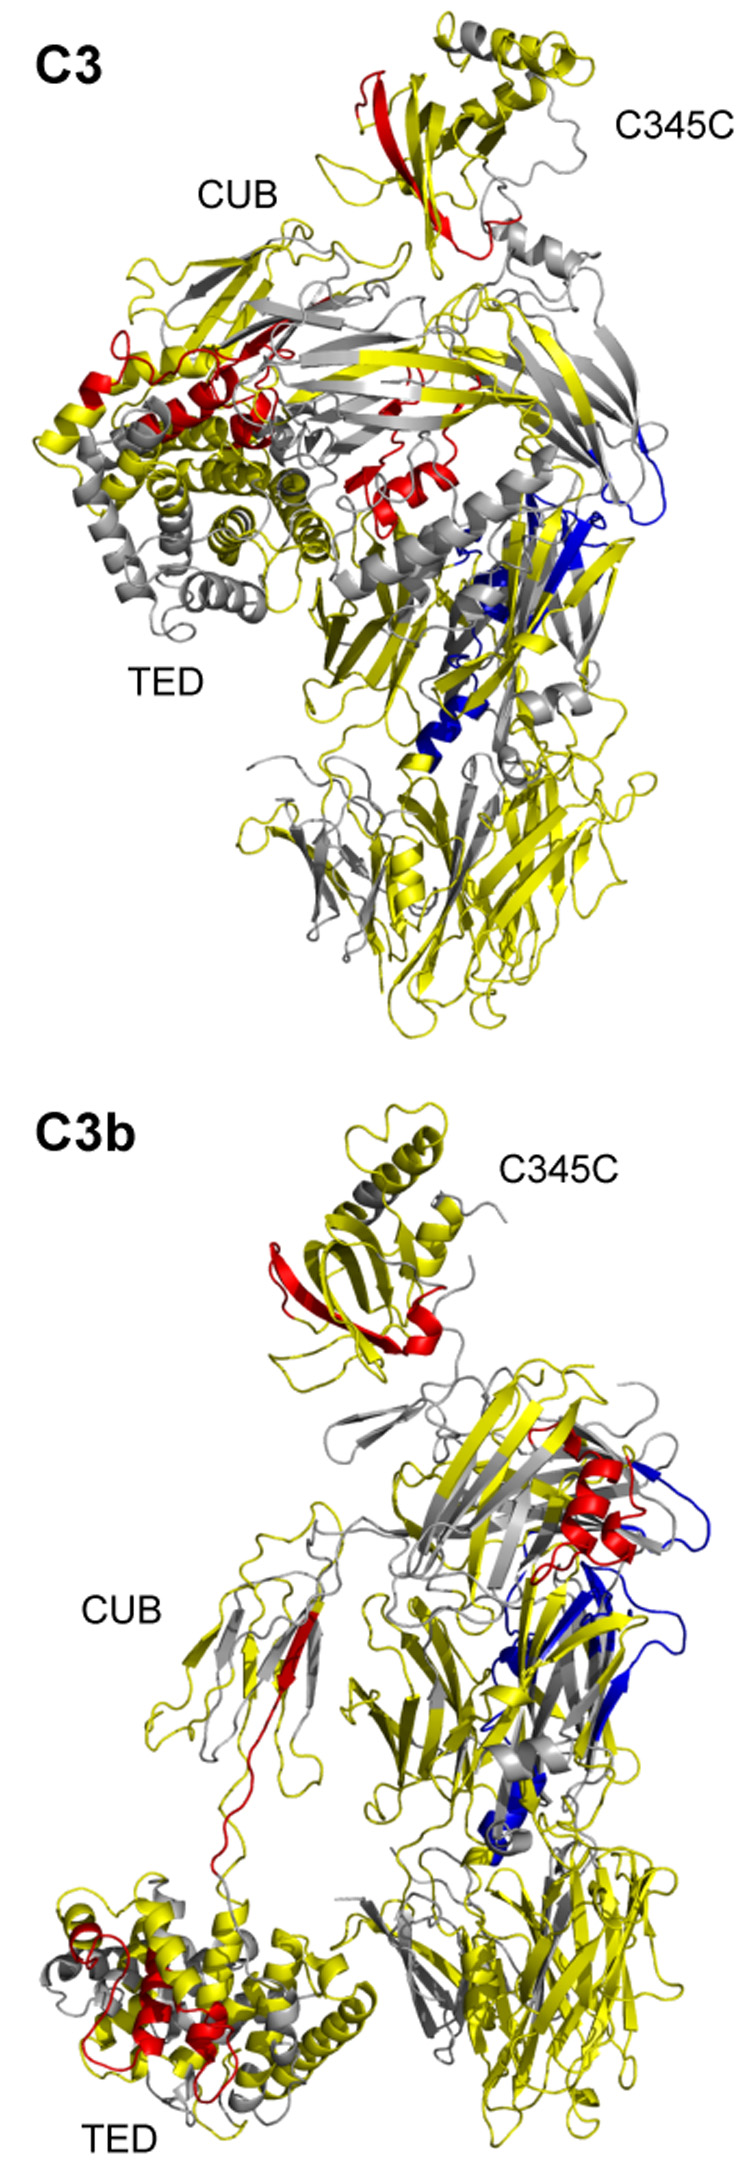
Fig. 2.

Mapping of differential HDX data on the C3 and C3b crystal structures. Peptides with increased exchange in C3b as compared to C3 are highlighted in red (average difference in deuteration ≥10%); peptides with decreased exchange in C3b as compared to C3 are in blue (≤−10%); peptides with minimal difference in exchange are in yellow (>−10% or <10%). Peptides for which no HDX data are available are represented in gray.
