
Fig. 3.
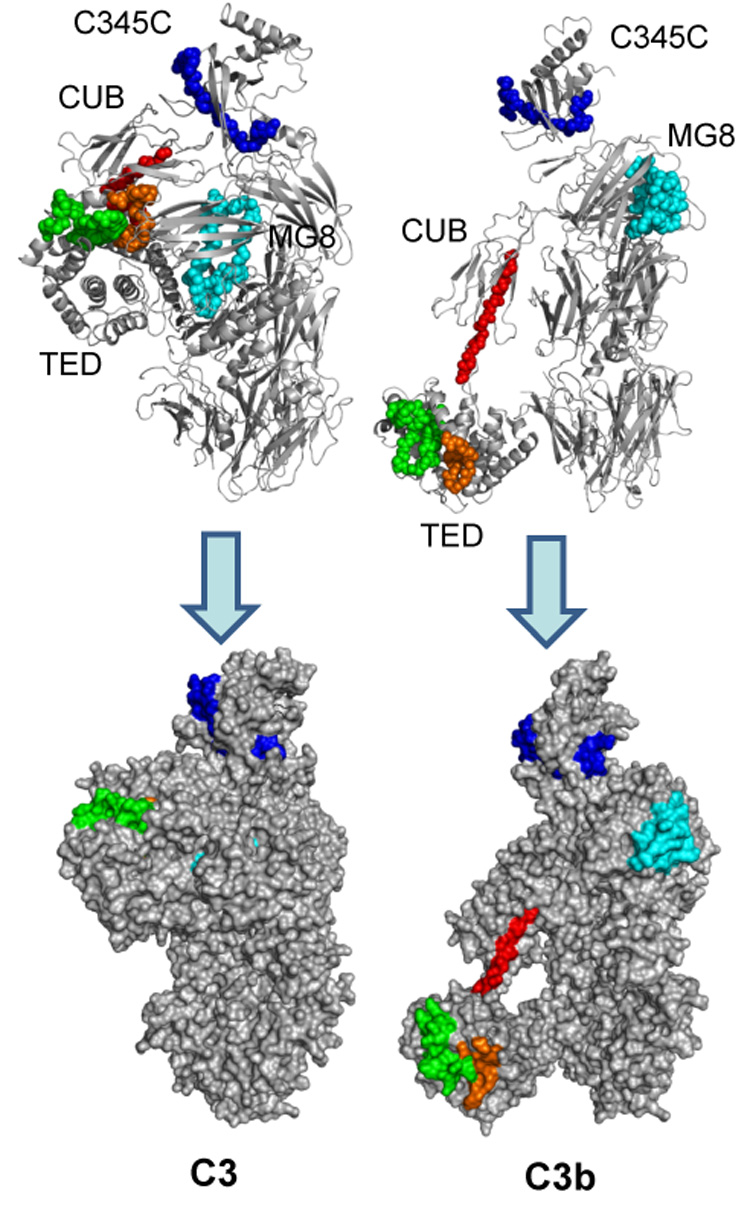
Areas that exhibit increased deuterium exchange upon activation of C3. Peptides with significantly increased HDX in C3b (≥10%) are highlighted in the crystal structures of C3 (left) and C3b (right). The backbones of these peptides are represented as balls in a cartoon representation in the top panels. In the bottom panel, the structures are represented as the calculated solvent-exposed surface. Peptide sequence identification: red = 956–968; green = 1189–1215; orange = 1237–1251; light blue = 1386–1415; blue = 1553–1570. In general, HDX data for these peptides are in agreement with reported changes in protein structure upon conversion of C3 to C3b.