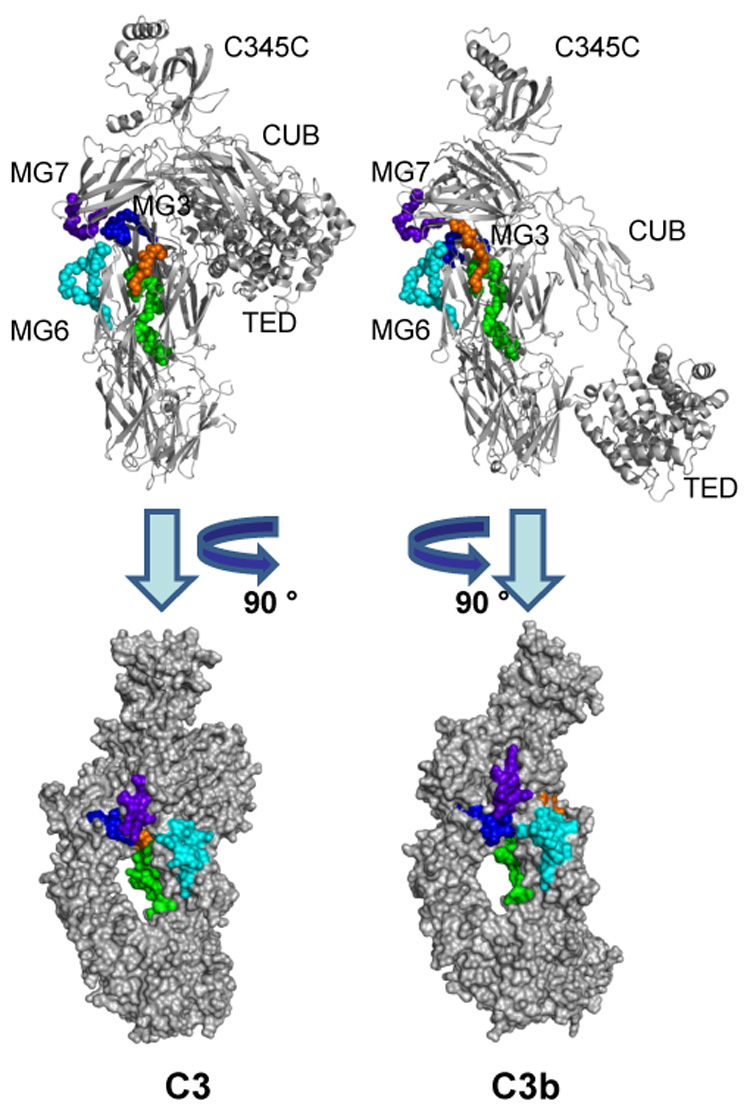
Fig. 4.

Areas that exhibit decreased deuterium exchange upon activation of C3. Peptides showing a significantly lower HDX (≤−10%) in C3b as compared to C3 are highlighted in the crystal structures of C3 (left) and C3b (right). The backbones of these peptides are represented as balls in a cartoon representation in the top panels to improve clarity. In the bottom panel, the structures have been rotated and represented as the calculated solvent-accessible surface. Peptide sequence identification: blue = 235–248; light blue = 542–560; green = 574–599; orange 742–750; purple = 830–839. While no large structural changes have been observed in the corresponding area of the crystal structures, these peptides form a cluster at the interface of the MG3, MG6, MG7, LNK, and α’NT domains that may show a higher degree of structural flexibility in solution. Peptide 1037–1043, which also showed decreased HDX in C3b, is located on the TED domain and does not contribute to the cluster described above. Its exact location and differential exposition is shown separately in Fig. 6.
