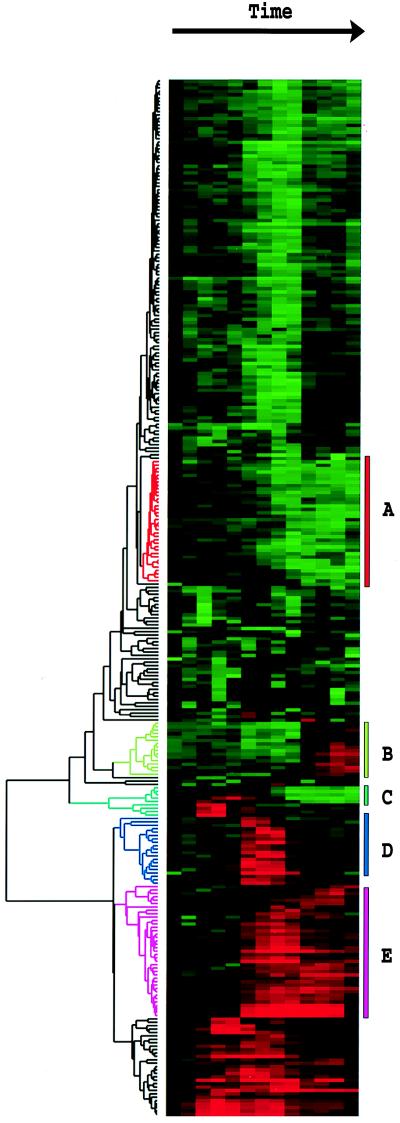
Figure 1.
Clustered display of data from time course of serum stimulation of primary human fibroblasts. Experimental details are described elsewhere (11). Briefly, foreskin fibroblasts were grown in culture and were deprived of serum for 48 hr. Serum was added back and samples taken at time 0, 15 min, 30 min, 1 hr, 2 hr, 3 hr, 4 hr, 8 hr, 12 hr, 16 hr, 20 hr, 24 hr. The final datapoint was from a separate unsynchronized sample. Data were measured by using a cDNA microarray with elements representing approximately 8,600 distinct human genes. All measurements are relative to time 0. Genes were selected for this analysis if their expression level deviated from time 0 by at least a factor of 3.0 in at least 2 time points. The dendrogram and colored image were produced as described in the text; the color scale ranges from saturated green for log ratios −3.0 and below to saturated red for log ratios 3.0 and above. Each gene is represented by a single row of colored boxes; each time point is represented by a single column. Five separate clusters are indicated by colored bars and by identical coloring of the corresponding region of the dendrogram. As described in detail in ref. 11, the sequence-verified named genes in these clusters contain multiple genes involved in (A) cholesterol biosynthesis, (B) the cell cycle, (C) the immediate–early response, (D) signaling and angiogenesis, and (E) wound healing and tissue remodeling. These clusters also contain named genes not involved in these processes and numerous uncharacterized genes. A larger version of this image, with gene names, is available at http://rana.stanford.edu/clustering/serum.html.

