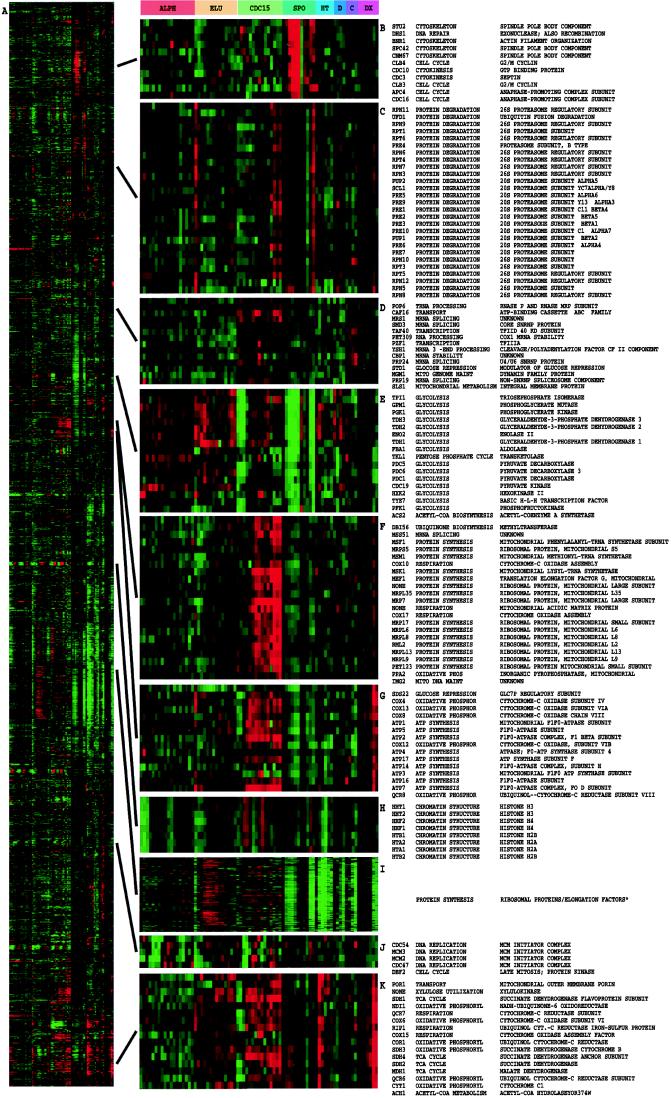
Figure 2.
Cluster analysis of combined yeast data sets. Data from separate time courses of gene expression in the yeast S. cerevisiae were combined and clustered. Data were drawn from time courses during the following processes: the cell division cycle (9) after synchronization by alpha factor arrest (ALPH; 18 time points); centrifugal elutriation (ELU; 14 time points), and with a temperature-sensitive cdc15 mutant (CDC15; 15 time points); sporulation (10) (SPO, 7 time points plus four additional samples); shock by high temperature (HT, 6 time points); reducing agents (D, 4 time points) and low temperature (C; 4 time points) (P. T. S., J. Cuoczo, C. Kaiser, P.O. B., and D. B., unpublished work); and the diauxic shift (8) (DX, 7 time points). All data were collected by using DNA microarrays with elements representing nearly all of the ORFs from the fully sequenced S. cerevisiae genome (8); all measurements were made against a time 0 reference sample except for the cell-cycle experiments, where an unsynchronized sample was used. All genes (2,467) for which functional annotation was available in the Saccharomyces Genome Database were included (12). The contribution to the gene similarity score of each sample from a given process was weighted by the inverse of the square root of the number of samples analyzed from that process. The entire clustered image is shown in A; a larger version of this image, along with dendrogram and gene names, is available at http://rana.stanford.edu/clustering/yeastall.html. Full gene names are shown for representative clusters containing functionally related genes involved in (B) spindle pole body assembly and function, (C) the proteasome, (D) mRNA splicing, (E) glycolysis, (F) the mitochondrial ribosome, (G) ATP synthesis, (H) chromatin structure, (I) the ribosome and translation, (J) DNA replication, and (K) the tricarboxylic acid cycle and respiration. The full-color range represents log ratios of −1.2 to 1.2 for the cell-cycle experiments, −1.5 to 1.5 for the shock experiments, −2.0 to 2.0 for the diauxic shift, and −3.0 to 3.0 for sporulation. Gene name, functional category, and specific function are from the Saccharomyces Genome Database (13). Cluster I contains 112 ribosomal protein genes, seven translation initiation or elongation factors, three tRNA synthetases, and three genes of apparently unrelated function.

