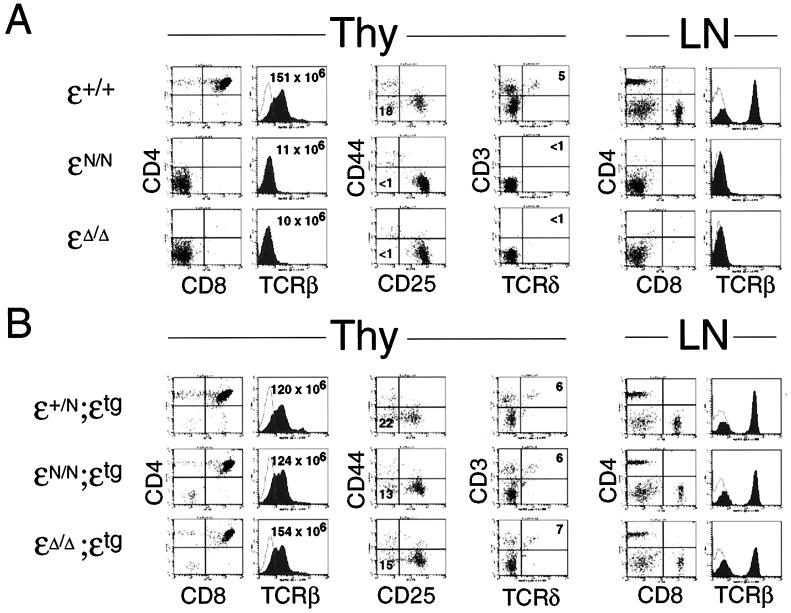
Figure 3.
(A) Phenotype of CD3ɛN/N and CD3ɛΔ/Δmice. Thy, thymocytes; LN, lymph node. The left two panels show two-color (CD4 vs. CD8) and single-color (TCRβ) analysis of thymocytes from (CD3)ɛ+/+, (CD3)ɛN/N, and (CD3)ɛΔ/Δmice. Total thymocyte numbers from representative mice are provided in the two color plots. The central panels show two-color (CD44 vs. CD25) and two-color (CD3 vs. TCRδ) staining of gated (CD4−CD8−B220−) thymocytes. Numbers in quadrants indicate percentage of gated cells within the quadrant. The right two panels show two-color (CD4 vs. CD8) and single-color (TCRβ) analysis of total lymph node cells. (B) Phenotype of CD3ɛN/N;ɛtg and CD3ɛΔ/Δ;ɛtg mice. The panels show representative data from (CD3)ɛ+/N, (CD3)ɛN/N, and (CD3)ɛΔ/Δmice that contain a CD3ɛ transgene under the control of the human CD2 promoter and enhancer sequences (founder line C7530). Analysis is identical to that described in A.

