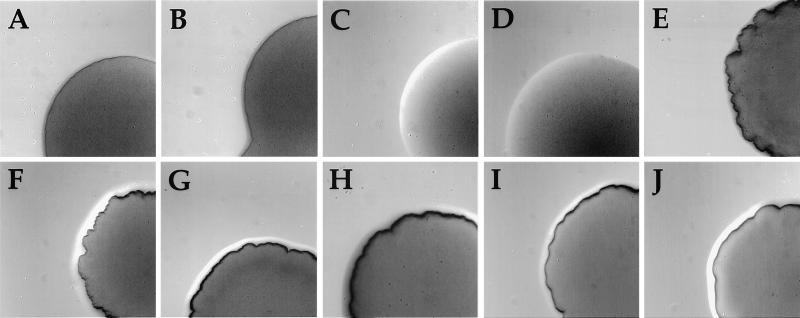
Figure 1.
Contributions of pilC and pilT to Tfp expression as assessed by colony morphologies, a readout of pilus-dependent autoagglutination. Colonies were photographed after 24 h of growth on Gc agar plates at a magnification of 70× using a stereomicroscope. (A) N400 (wild-type). (B) MW1 (pilC1∷erm). (C) MW2 (pilC2∷cat). (D) MW3 (pilC1∷erm, pilC2∷cat). (E) MW4 (pilTind). (F) MW5 (pilTind, pilC1∷erm). (G) MW6 (pilTind, pilC2∷cat). (H) MW7 (pilTind, pilC1∷erm, pilC2∷cat). (I) MW8 (pilTdud1, pilC2off). (J) MW9 (pilTΔQSL, pilC2?—a variant in which PilC2 does not associate with pili).

