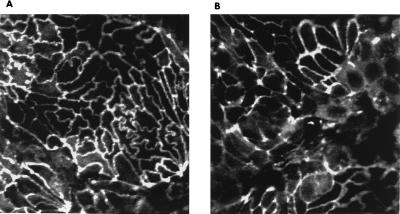
Figure 3.
ZO1 redistribution in HT29/C1 cells after BFT treatment. Polarized HT29/C1 cells were treated with BFT (5 nM) for 1 hr and assessed by confocal immunofluorescent microscopy. (A) Control cells reveal the even membrane distribution of ZO1. (B) ZO1 immunofluorescence is more diffuse and punctate after BFT treatment. (Magnification, ×1,000.)

