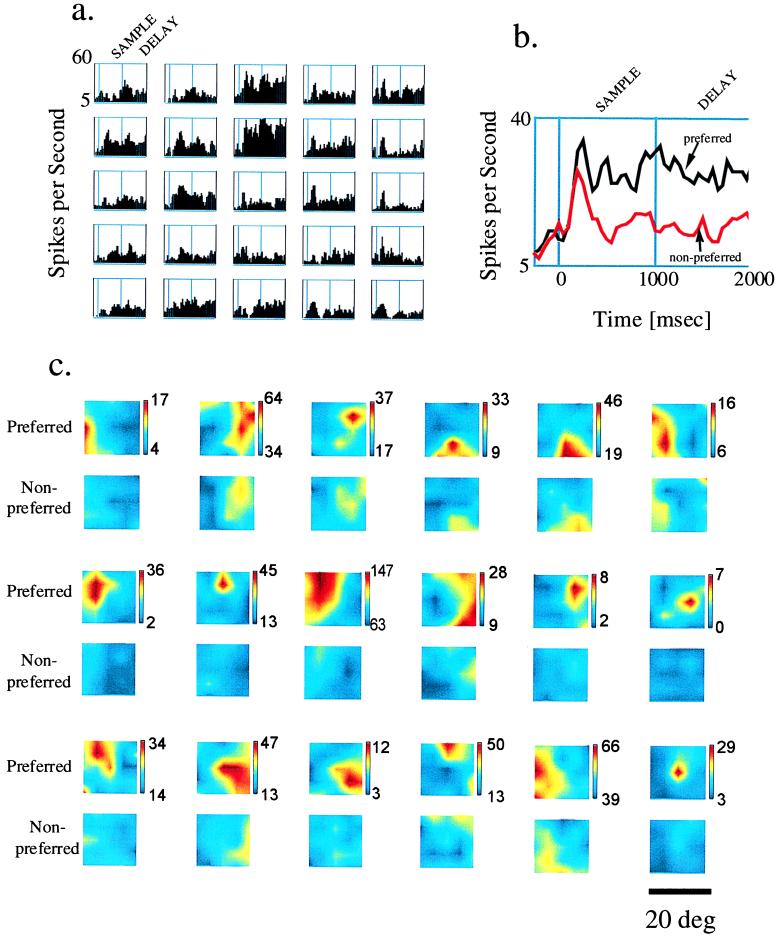
Figure 2.
(a) Histograms of a single PF neuron’s activity to an object appearing at each of the 25 tested locations. The line to the left of each histogram shows time of sample onset, and the line in the middle denotes sample offset. Bin width, 40 ms. The y-axis indicates firing rate in spikes per second, and the x-axis indicates time. The time scale for each histogram is identical to the histogram shown in b. (b) Activity of the same neuron to a preferred and nonpreferred object appearing within the neuron’s MF. (c) MF plots of 18 what-and-where PF neurons. Preferred and nonpreferred refer to the objects used to map the MFs shown in each square. Each square represents the tested 20° of central vision with fixation at the center. For each neuron, the blue-to-red color map indicates the level of delay activity elicited by a preferred or nonpreferred object appearing at that region of visual field. Blue indicates the neuron’s baseline level of activity, and red indicates the neuron’s maximum delay activity. A scale bar indicates, for each neuron, the relationship between color and firing rate in spikes per second. The neuron illustrated in a and b is depicted in the middle row, second from the left of c.

