Figure 1.
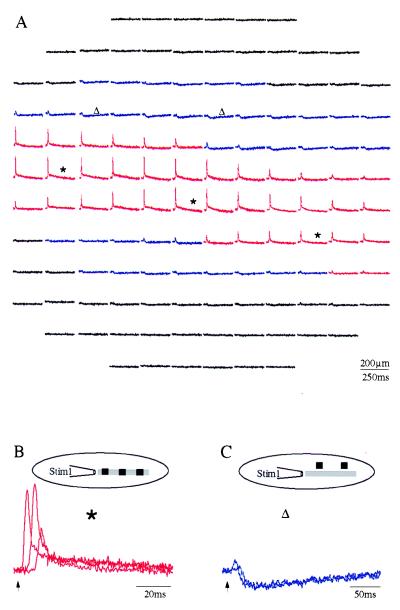
A single surface stimulus elicited a beam-like response. (A) The data are displayed as absolute change in fluorescence as a function of time in 128 sites in the cerebellar cortex. The calibration bar gives the scales for both time and space. The stimulating electrode was placed on the surface of the cerebellar cortex to the left of the recorded area. Each of the 128 traces is an average response of three identical stimuli repeated at a frequency of 0.3 Hz. The stimulus elicited a wave of positive responses (red), which propagated in a beam along the cerebellar folium. Negative signals (blue) were observed lateral to the positive beam. This well defined, narrow positive beam was always observed, but the negative signals were not detected in all experiments. (B) The traces marked with asterisks in A were superimposed to show that the signal propagated with a conduction velocity of 0.2 m/s. (C) The traces marked with triangles in A are superimposed on one another. Arrows denote the time of stimuli. The Insets in B and C are schematic representations of the experimental arrangement. A thick gray line represents the activated beam. The locations of the recording sites relative to the beam are marked by black rectangles.

