Figure 3.
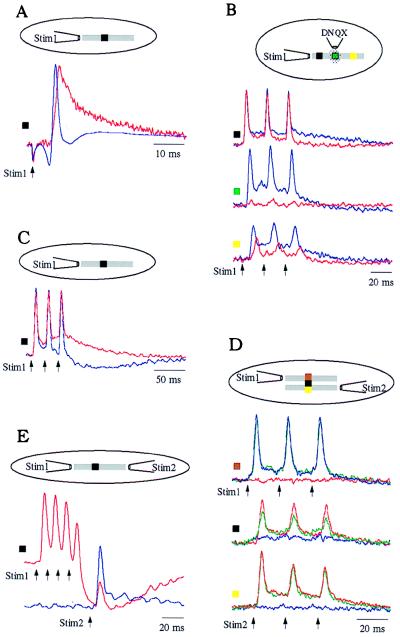
Characterization of the optical signal. (A) The optical signal (red trace) and the field potential (blue trace) were recorded at the same location with the recording electrode close to the cerebellar surface. The negative peak of the electrical signal (inversely displayed) represents the parallel-fiber action potentials. It preceded the peak of the optical signal by 1 ms. The slow negative wave of the electrical response, which represents the postsynaptic excitation in Purkinje cells and other cortical cells, correlated with the slow positive decay of the optical response. The arrow denotes the time of stimulus. (B) DNQX blocked the optical response to surface stimulation. The three panels show responses recorded at three locations along the activated beam (see inset). The blue traces are the control, and the red traces are the responses after local application of DNQX at the location of the green rectangle (see inset). (C) Bicuculline blocked the on-beam negative signal. The blue and red traces were recorded before and after bath application of 50 μM bicuculline, respectively. (D) Lateral inhibition. Responses were recorded at three adjacent locations across two activated beams (see inset). The blue and the red traces are the responses to stimulation of the upper beam (stim 1) and the lower beam (stim 2), respectively. The green traces are the responses to simultaneous stimulation of both beams. The green trace (Middle; black rectangle) was smaller than the red trace, indicating that activity in the upper beam inhibited the lower-beam activity only in the region between the two beams. (E) On-beam inhibition. The response to a test stimulus (blue trace, stim 2 in the inset) was decreased by on-beam inhibition evoked by a train of stimuli (stim 1, red trace). Similar results were obtained with a shorter train of stimuli provided on-beam inhibition was generated.

