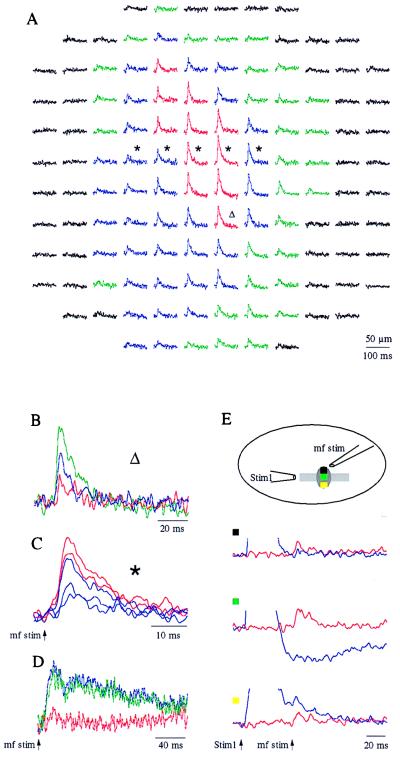
Figure 4.
Patch-like response evoked by white-matter stimulation. (A) The traces shown (obtained at a gain of 40× and displayed as in Fig. 1A) were obtained at high stimulus intensity. The red, blue, and green traces denote the activated areas at increasing stimulus intensities. Only the area marked in red was activated at the lowest stimulus intensity. At intermediate stimulus intensity, the activated area increased and is marked both by red and blue. (B) Superimposed responses to stimulation at the three intensities, at the location marked by a triangle in A. (C) The traces marked with ∗ in A were superimposed to show that response onsets and peaks occurred at the same time in all locations. (D) The patch of activity was reversibly blocked by Co2+. Each of the traces shown is the average response of seven diodes measured before (blue trace) and during (red trace) application of 5 mM Co2+. After washing, the response reappeared (green trace). (E) The patch-like response was blocked by on-beam inhibition. Responses in three locations across the activated beam (see inset) are shown. A train of stimuli (stim 1 in the inset) generated the on-beam inhibition. The response to white-matter stimulation (mf stim, red traces) and the response to both stimuli (mf stim and stim 1, blue traces; note that the positive responses to stim 1 were truncated) were superimposed. The response to mossy-fiber stimulation was completely blocked by the on-beam inhibition in the center of the activated beam (green rectangle; the response to mf stim seen in the red trace is missing in the blue trace). The response was partially blocked near the edge of the beam (black and yellow rectangles; the response to mf stim in the red traces is larger than the response to mf stim in the blue traces).

