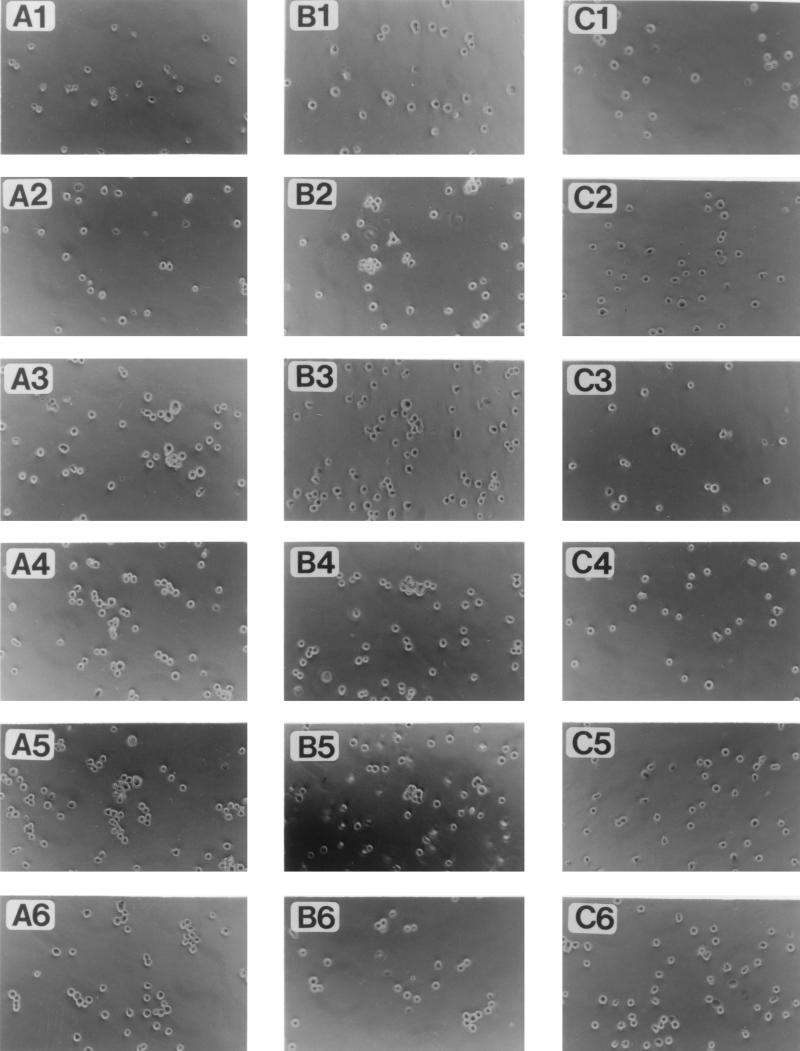
Figure 4.
Light microscopic observation of cell aggregation as a function of time after mixing cells and/or reagents: column A, β-APP-transfected cells with PS-1-transfected cells; column B, PS-1-transfected cells mixed with anti-PS-1 antibodies, in the absence of β-APP-transfected cells; column C, PS-1-transfected cells alone. In all columns, the rows 1–6 represent the times 2, 4, 6, 8, 10, and 12 min, respectively, after mixing. In column A, the β-APP-transfected cells and PS-1-transfected cells began to show significant aggregation by 6 min (A3); in column B, the anti-PS-1 antibodies caused the PS-1-transfected cells to aggregate by 4 min (B2); in column C, no aggregation occurred.

