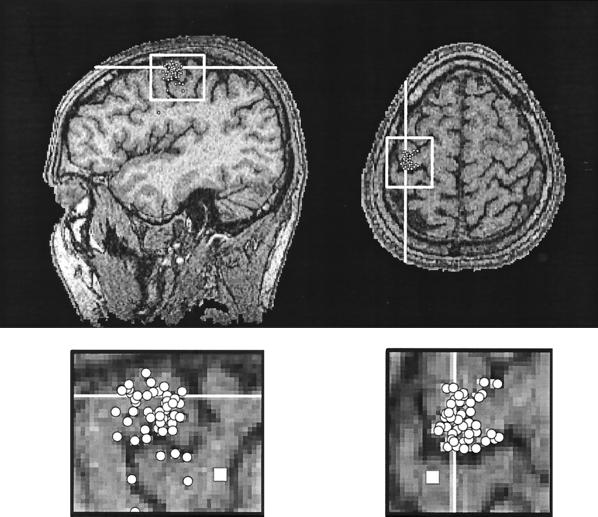
Figure 3.
Source locations of the 20-Hz activity in the left hemisphere of subject SS. The dots illustrate single, equivalent current dipoles used to model the field pattern during single cycles of the 20-Hz oscillation. The clusters are enlarged below and illustrate a clear concentration of sources to the precentral motor cortex, just anterior to the central sulcus. The squares illustrate the source of the 20-ms response to right median nerve stimulation.

