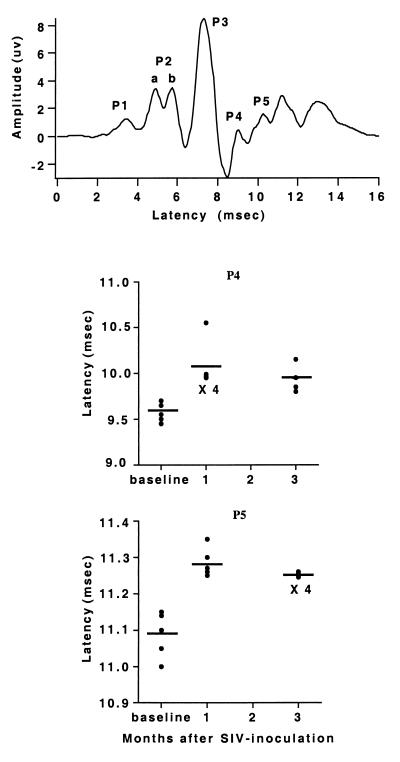
Figure 4.
BSAEP latencies. (Upper) Representative waveform tracing. (Lower) Plots of individual values (circles) and averages (lines) of the latency of P4 and P5. The P4 and P5 latencies measured at both 1 and 3 months after inoculation are significantly different than preinfection values (ANOVA with post hoc t test, P < 0.05).

