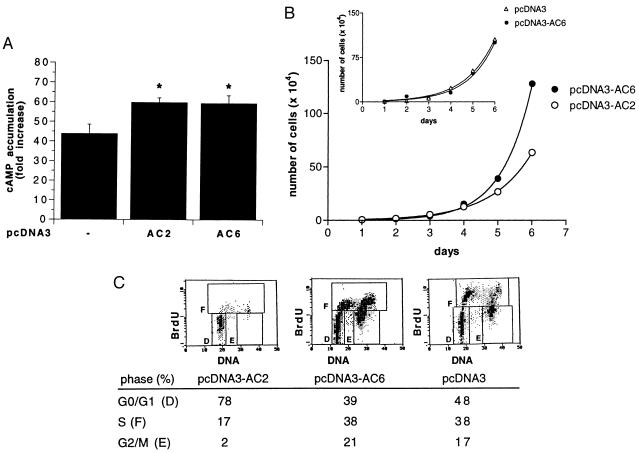
Figure 2.
Expression of AC2 and AC6 isoforms in NIH 3T3 cells: effects on forskolin-induced cAMP accumulation (A), cell proliferation (B), and cell cycle (C). (A) Cells were stimulated with or without forskolin (10 μM) for 30 min, and cAMP accumulation was measured. Values represent fold increase above basal [basal control (pcDNA3), 3.8; AC2, 3.0; and AC6-expressing cells, 3.1], means ± SEM (n = 6). The asterisk indicates a significant difference (P < 0.05) from control (pcDNA3) cells as determined by a Student’s t test. (B) Growth curves of clonal cell lines stably expressing the epitope-tagged AC2 (open circles) and AC6 (closed circles) isoform or empty vector (pcDNA3, open triangles) (inset). The experiment is a representative of three experiments. Values are means of triplicate determinations with a standard error smaller than 5%. (C) Distribution of a population of cells in different phases [G0/G1 phase (D), G2/M population (E), and S-phase population (F)] after 24 hr of growth arrest followed by 12 hr of stimulation with DMEM containing 5% serum. BrdU uptake as measured by fluorescein isothiocyanate fluorescence is depicted on the y axis. DNA content as measured by propidium iodide fluorescence is depicted on the x axis. The data are representative of three experiments.

