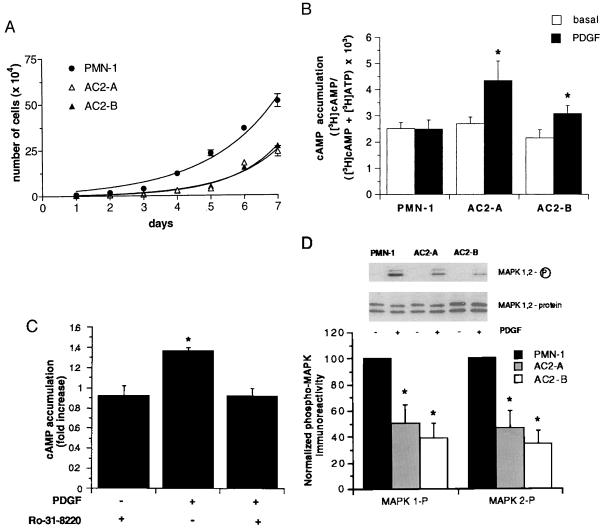
Figure 3.
Ectopic expression of AC2 by using an inducible promoter: effects on cell proliferation (A), on PDGF-induced cAMP accumulation (B and C), and on MAPK 1,2 activity (D). (A) Growth curves of clonal cell lines cells stably expressing AC2 (open triangles, clonal cell line A; closed triangles, clonal cell line B) or empty vector PMN-1 (closed circles). Cells were treated with dexamethasone (1 μM) every other day for 2 weeks. Values are means ± SEM of three separate experiments performed in triplicate. (B and C) Cells were stimulated with or without PDGF (20 ng/ml) for 30 min, and, in C, AC2-expressing cells were preincubated with or without the PKC inhibitor Ro-31–8220 (10 μM) for 30 min. Values are means ± SEM of triplicate determinations of at least four independent experiments. The asterisk indicates a significant difference (P < 0.05) from nontreated cells as determined by a Student’s t test. (D) Immunoblots of phospho-MAPK 1,2 and total MAPK 1,2 in extracts from cells treated with or without PDGF (20 ng/ml) for 5 min after 24 hr of serum starvation (upper blot). Equal aliquots were used. The immunoblots are representative of three experiments. Quantification of phospho-MAPK 1,2 (upper band p44, MAPK 1, lower band p42, MAPK 2) (lower part). Increase in MAPK 1,2 phosphorylation was corrected for total MAPK 1,2 protein. Values represent means ± SEM of three independent experiments. The asterisk indicates a significant difference (P < 0.05) from control cells as determined by a Student’s t test.

