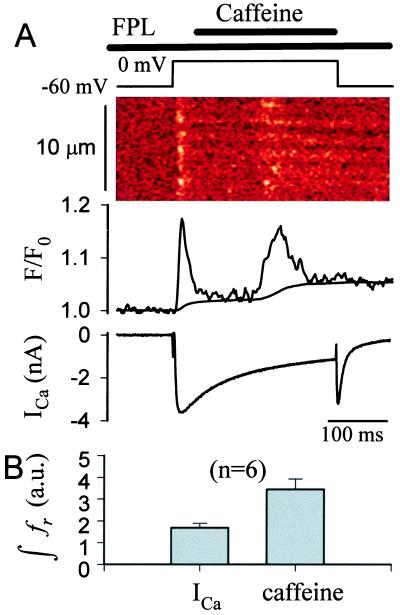
Figure 3.
Caffeine-induced Ca2+ release during the maintained phase of ICa. (A Top to Bottom) voltage protocol, confocal line-scan image, spatially averaged OG-5N fluorescence signal, and the simultaneously measured ICa. FPL (10 μM) was applied 10 s before depolarization, and caffeine was rapidly injected onto the cell 40 ms after the onset of depolarization. The smooth line in the Middle panel represents fs. (B) Amount of SR Ca2+ released by ICa and caffeine quantified by integrating their respective release fluxes (fr) transients (n = 6).

